
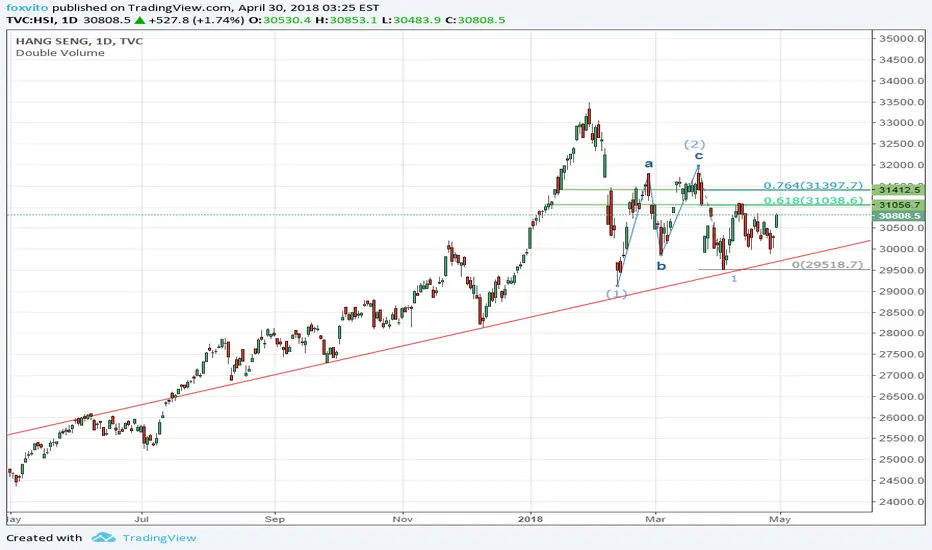
As stated in the diagram. HSI might go downward as the fibonacci ratio match. The target of the wave may be 26000.
If we see any strong resistance at 31000 or 31400 in this week. It is very likely that HSI will follow this trend to move
If we see any strong resistance at 31000 or 31400 in this week. It is very likely that HSI will follow this trend to move
Trade wurde manuell geschlossen
Unfortunately, HSI cannot stand on 0.764 (around 31400). See it immediately drop under it the next day.As now the RSI is very low and comes to a critical support line. I close the position first. Wait and see if it is a rebound or a new raising wave.
Trade geschlossen: Stop wurde erreicht

Haftungsausschluss
Die Informationen und Veröffentlichungen sind nicht als Finanz-, Anlage-, Handels- oder andere Arten von Ratschlägen oder Empfehlungen gedacht, die von TradingView bereitgestellt oder gebilligt werden, und stellen diese nicht dar. Lesen Sie mehr in den Nutzungsbedingungen.
Haftungsausschluss
Die Informationen und Veröffentlichungen sind nicht als Finanz-, Anlage-, Handels- oder andere Arten von Ratschlägen oder Empfehlungen gedacht, die von TradingView bereitgestellt oder gebilligt werden, und stellen diese nicht dar. Lesen Sie mehr in den Nutzungsbedingungen.