
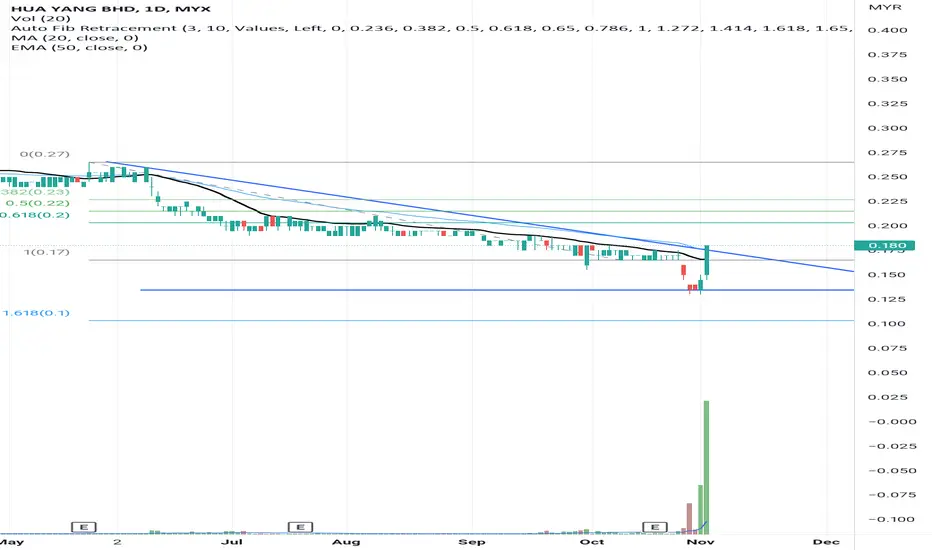
The candlestick indicates a price breakout above the " triangle" pattern neckline on 2 Oct 2022 backend with volumes. Thus, closed above the SMA line where the stock has consolidated and formed a "return move".
The MACD indicates a divergent pattern where confirming the initial significant price movement toward the next price resistance.
The RSI indicates a bullish reading backed by a positive signals in the trend.
Let's save HUAYANG in WL and watch out significant price movement toward the next price resistant backed by volumes.
R 0.195
S 0.160

Haftungsausschluss
Die Informationen und Veröffentlichungen sind nicht als Finanz-, Anlage-, Handels- oder andere Arten von Ratschlägen oder Empfehlungen gedacht, die von TradingView bereitgestellt oder gebilligt werden, und stellen diese nicht dar. Lesen Sie mehr in den Nutzungsbedingungen.
Haftungsausschluss
Die Informationen und Veröffentlichungen sind nicht als Finanz-, Anlage-, Handels- oder andere Arten von Ratschlägen oder Empfehlungen gedacht, die von TradingView bereitgestellt oder gebilligt werden, und stellen diese nicht dar. Lesen Sie mehr in den Nutzungsbedingungen.