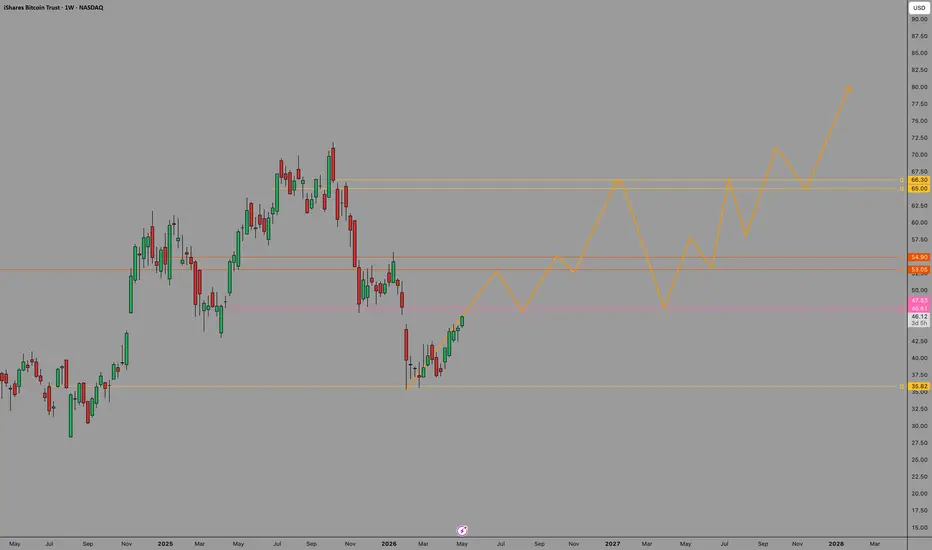
 IBIT — Weekly
One level matters right now: $47.
That's the flip zone. Resistance needs to become support before this moves anywhere meaningful.
If it holds:
→ Rally into year-end
→ Flush in 2027 (shakeout, not the end)
→ New ATH by 2028
Invalidation: lose $35.82 on the weekly and the thesis is dead.
Not financial advice. Just watching the map.
Trade ist aktiv
Update: Re-reading this idea, the original map was off. The real question was never $47. It was where the bottom forms.What the structure shows now:
→ Low: summer 2026, ~$33
→ Higher high: September pushed to ~$49, breaking the last lower high. First crack in the downtrend.
→ Now: the pullback needs to hold the $40–44 area and form a higher low
If that higher low holds:
→ Break above $49 = confirmation of the new uptrend
→ Rally toward $53–55, then $65–66
→ 2027 pullback (shakeout, not the end)
→ New ATH (~$80) by 2028
Invalidation:
- A weekly close below $40 = higher low failed, and I'd reassess
- A weekly close below $33 = the bottom isn't in, and the thesis is dead
Not financial advice. Bottom → higher high → higher low. Now we test step 3.

Haftungsausschluss
Die Informationen und Veröffentlichungen sind nicht als Finanz-, Anlage-, Handels- oder andere Arten von Ratschlägen oder Empfehlungen gedacht, die von TradingView bereitgestellt oder gebilligt werden, und stellen diese nicht dar. Lesen Sie mehr in den Nutzungsbedingungen.
Haftungsausschluss
Die Informationen und Veröffentlichungen sind nicht als Finanz-, Anlage-, Handels- oder andere Arten von Ratschlägen oder Empfehlungen gedacht, die von TradingView bereitgestellt oder gebilligt werden, und stellen diese nicht dar. Lesen Sie mehr in den Nutzungsbedingungen.