
Topic Statement:
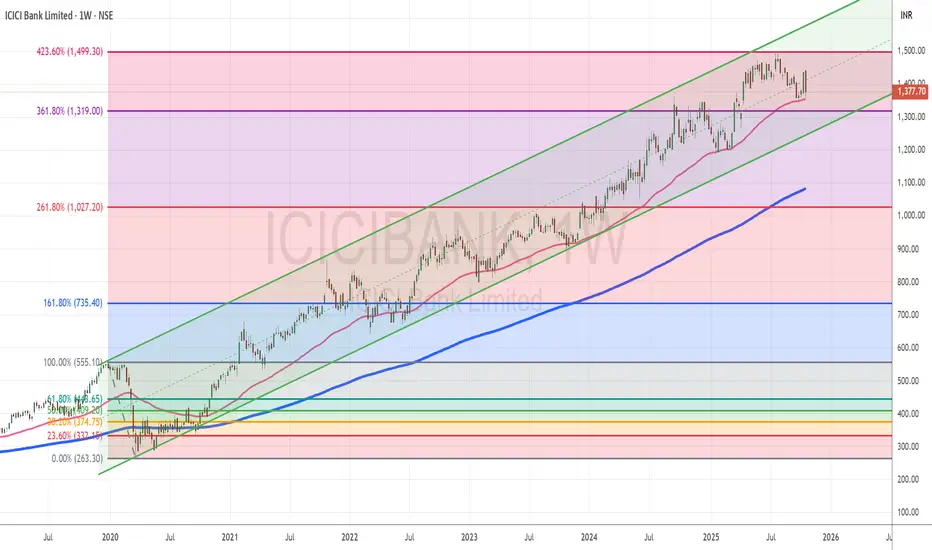
ICICI Bank continues its long-term bull run, supported consistently by technical levels, but now approaches a key resistance near the 1500 mark.
Key Points:
1. The stock trades reliably within a well-defined up-trending channel, maintaining long-term bullish structure
2. Price is repeatedly supported by the 50-day EMA, acting as a dynamic floor throughout its rallies
3. It has only dipped below the 200-day EMA during rare deep corrections, like the COVID crash of 2020
4. Based on the Fibonacci levels plotted from the 2020 correction, the 423.6% extension lies near 1500 — a level already reached, where the stock may now face stiff resistance
ICICI Bank continues its long-term bull run, supported consistently by technical levels, but now approaches a key resistance near the 1500 mark.
Key Points:
1. The stock trades reliably within a well-defined up-trending channel, maintaining long-term bullish structure
2. Price is repeatedly supported by the 50-day EMA, acting as a dynamic floor throughout its rallies
3. It has only dipped below the 200-day EMA during rare deep corrections, like the COVID crash of 2020
4. Based on the Fibonacci levels plotted from the 2020 correction, the 423.6% extension lies near 1500 — a level already reached, where the stock may now face stiff resistance

Haftungsausschluss
Die Informationen und Veröffentlichungen sind nicht als Finanz-, Anlage-, Handels- oder andere Arten von Ratschlägen oder Empfehlungen gedacht, die von TradingView bereitgestellt oder gebilligt werden, und stellen diese nicht dar. Lesen Sie mehr in den Nutzungsbedingungen.
Haftungsausschluss
Die Informationen und Veröffentlichungen sind nicht als Finanz-, Anlage-, Handels- oder andere Arten von Ratschlägen oder Empfehlungen gedacht, die von TradingView bereitgestellt oder gebilligt werden, und stellen diese nicht dar. Lesen Sie mehr in den Nutzungsbedingungen.