
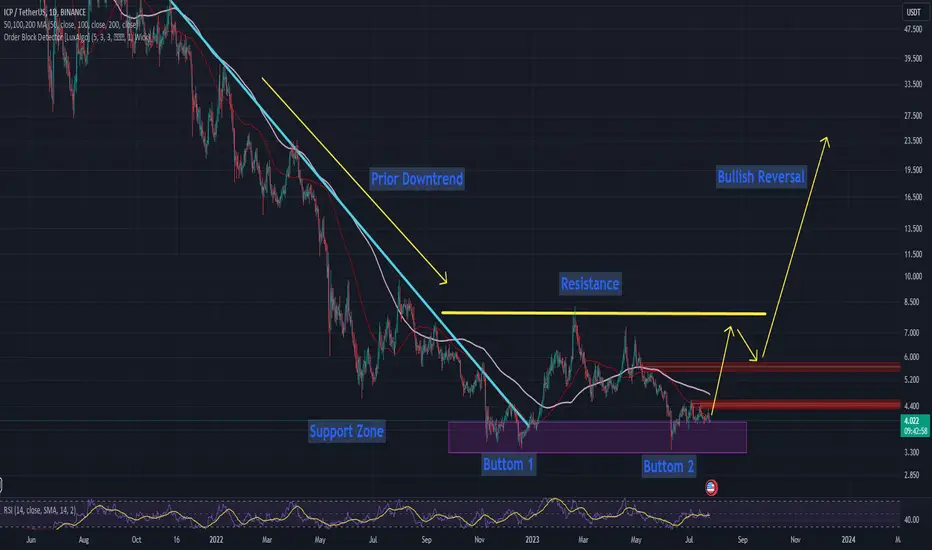
A double bottom pattern is a classical pattern that indicates a change in trend and a shift in momentum from bearish to bullish. It is composed of two consecutive troughs that bottom out at roughly the same price level. This level acts as a support for the price. The double bottom formation is a bullish reversal pattern that is created after a prolonged downtrend. In order to identify this pattern, you will need to look for the following:
1. Two distinct troughs that bottom out at roughly the same price level.
2. A moderate rally in between the two troughs, creating a resistance.
3. A break above the resistance after the 2nd trough is formed.
If you see a chart with these characteristics, you have recognized a double bottom pattern.
This pattern is regarded as a very reliable reversal signal, and traders frequently use it to enter long positions.
1. Two distinct troughs that bottom out at roughly the same price level.
2. A moderate rally in between the two troughs, creating a resistance.
3. A break above the resistance after the 2nd trough is formed.
If you see a chart with these characteristics, you have recognized a double bottom pattern.
This pattern is regarded as a very reliable reversal signal, and traders frequently use it to enter long positions.
Anmerkung
Liquidation MapShort 🩸 🩸🩸 3 M ⚠️ -> $4.48
Longs ✅✅ ✅ 300 k -> $3.6
Anmerkung
Liquidation MapShort 🩸 🩸🩸 5.32 M ⚠️⚠️⚠️ -> $ 4.5
Longs ✅✅ ✅ 100 k -> $3.12
Trade ist aktiv
The upward price explosion liquidating the shorts can be monstrous.Trade ist aktiv
The idea is still valid. ✅✅✅It is a long-term position 💎💎💎
Trade ist aktiv
First resistance 4.5 -> BROKEN ✅Second resistance 5.7 -> In progress 💎
Trade ist aktiv
First resistance 4.5 -> BROKEN ✅Second resistance 5.7 -> BROKEN ✅
Trade ist aktiv
Thanks to everyone who supported me, enjoy the profits. This is for the long term!
Haftungsausschluss
Die Informationen und Veröffentlichungen sind nicht als Finanz-, Anlage-, Handels- oder andere Arten von Ratschlägen oder Empfehlungen gedacht, die von TradingView bereitgestellt oder gebilligt werden, und stellen diese nicht dar. Lesen Sie mehr in den Nutzungsbedingungen.
Haftungsausschluss
Die Informationen und Veröffentlichungen sind nicht als Finanz-, Anlage-, Handels- oder andere Arten von Ratschlägen oder Empfehlungen gedacht, die von TradingView bereitgestellt oder gebilligt werden, und stellen diese nicht dar. Lesen Sie mehr in den Nutzungsbedingungen.