Long
ICX falling wedge - Indicating a potential breakout (FINALLY)
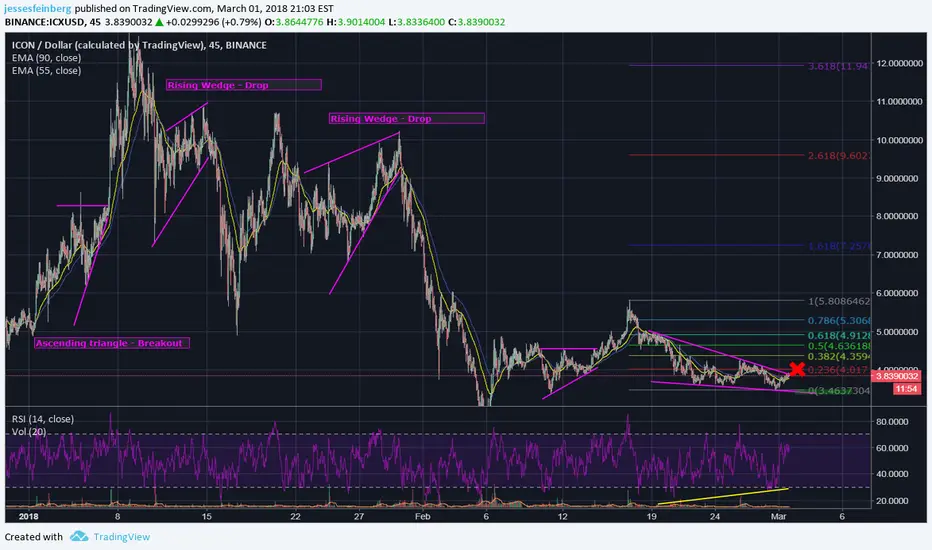
 ICXUSD is a project with both great fundamentals, and potentially great technical indicators at the moment. It got hit especially hard during the recent market correction, retracing over 80% to the current bottom (from a high over $12). I'm hoping for an equally strong rebound.
It has been following the rules pretty closely as far as wedge patterns. Ascending triangles are predicting a rise, while rising, or bearish, wedges are predicting a drop. We are consolidating within a falling, or bullish, wedge right now. This indicates a potential breakout. Bullish divergence on RSI could also indicate a trend change.
If you're curious, I used the USD pairing for the chart because it more accurately illustrates the wedge patterns, and the adherence to it that's particularly relevant.
What I'm watching for:
- If we break out of the wedge, I'll start buying when we have confirmation at the 0.236 fib level (X)
- If we get rejected, I would buy at the bottom of the wedge channel (green box)
Good luck, be safe, and as always, DO YOUR OWN RESEARCH! This analysis is only my opinion, and I may be an idiot! Thank you :)

Haftungsausschluss
Die Informationen und Veröffentlichungen sind nicht als Finanz-, Anlage-, Handels- oder andere Arten von Ratschlägen oder Empfehlungen gedacht, die von TradingView bereitgestellt oder gebilligt werden, und stellen diese nicht dar. Lesen Sie mehr in den Nutzungsbedingungen.
Haftungsausschluss
Die Informationen und Veröffentlichungen sind nicht als Finanz-, Anlage-, Handels- oder andere Arten von Ratschlägen oder Empfehlungen gedacht, die von TradingView bereitgestellt oder gebilligt werden, und stellen diese nicht dar. Lesen Sie mehr in den Nutzungsbedingungen.