Long
IDFC BULLISH
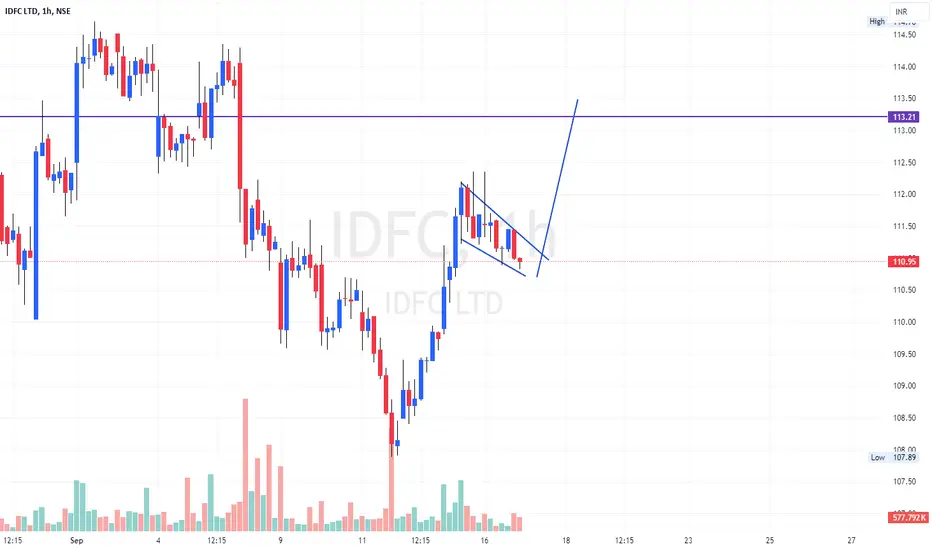
A Bullish Flag is a technical analysis pattern that suggests a potential continuation of a bullish trend. Here's a description of the Bullish Flag pattern in IDFC :
Pattern Description:
Flagpole: The stock price of IDFC has been in a strong uptrend, forming a flagpole (a sharp, almost vertical rise in price).
Consolidation: After the flagpole, the stock price has consolidated within a narrow range, forming a flag (a rectangular or triangular shape).
Upper and Lower Boundaries: The flag has upper and lower boundaries, which are roughly parallel to each other.
Breakout: The stock price is expected to break out above the upper boundary of the flag, continuing the bullish trend.
Pattern Description:
Flagpole: The stock price of IDFC has been in a strong uptrend, forming a flagpole (a sharp, almost vertical rise in price).
Consolidation: After the flagpole, the stock price has consolidated within a narrow range, forming a flag (a rectangular or triangular shape).
Upper and Lower Boundaries: The flag has upper and lower boundaries, which are roughly parallel to each other.
Breakout: The stock price is expected to break out above the upper boundary of the flag, continuing the bullish trend.
Anmerkung
SL hit
Haftungsausschluss
Die Informationen und Veröffentlichungen sind nicht als Finanz-, Anlage-, Handels- oder andere Arten von Ratschlägen oder Empfehlungen gedacht, die von TradingView bereitgestellt oder gebilligt werden, und stellen diese nicht dar. Lesen Sie mehr in den Nutzungsbedingungen.
Haftungsausschluss
Die Informationen und Veröffentlichungen sind nicht als Finanz-, Anlage-, Handels- oder andere Arten von Ratschlägen oder Empfehlungen gedacht, die von TradingView bereitgestellt oder gebilligt werden, und stellen diese nicht dar. Lesen Sie mehr in den Nutzungsbedingungen.