
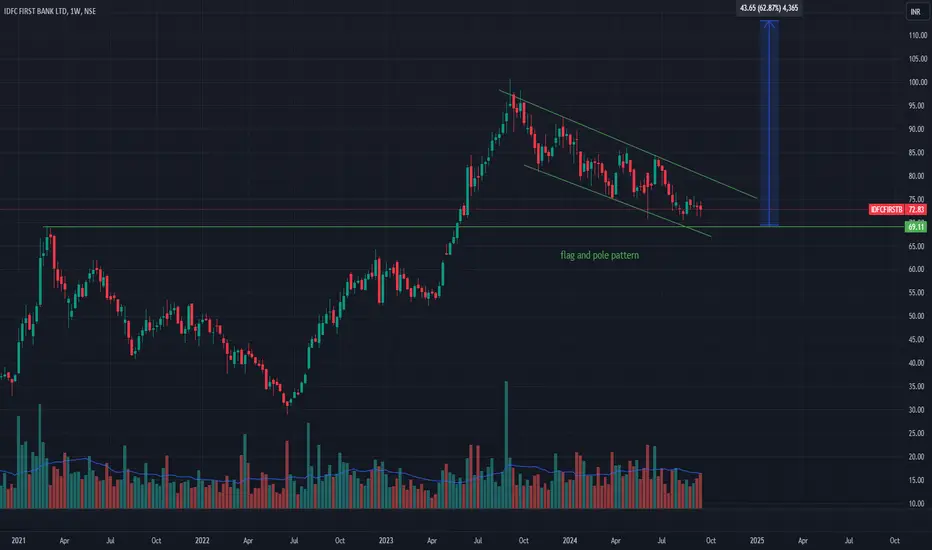
Potential breakout in the making!
IDFC First Bank is showing a flag and pole pattern on the weekly timeframe, which indicates a strong continuation signal. This pattern generally forms after a sharp price move (the "pole") followed by a consolidation phase (the "flag"). We are now approaching a potential breakout point.
🔍 Key Highlights:
Pattern: Flag and pole
Timeframe: Weekly
Potential breakout zone: Trendline
Volume activity: Watch for a volume surge during the breakout.
If this breaks out, we could see strong upward momentum. Keep an eye on this stock!
IDFC First Bank is showing a flag and pole pattern on the weekly timeframe, which indicates a strong continuation signal. This pattern generally forms after a sharp price move (the "pole") followed by a consolidation phase (the "flag"). We are now approaching a potential breakout point.
🔍 Key Highlights:
Pattern: Flag and pole
Timeframe: Weekly
Potential breakout zone: Trendline
Volume activity: Watch for a volume surge during the breakout.
If this breaks out, we could see strong upward momentum. Keep an eye on this stock!

Haftungsausschluss
Die Informationen und Veröffentlichungen sind nicht als Finanz-, Anlage-, Handels- oder andere Arten von Ratschlägen oder Empfehlungen gedacht, die von TradingView bereitgestellt oder gebilligt werden, und stellen diese nicht dar. Lesen Sie mehr in den Nutzungsbedingungen.
Haftungsausschluss
Die Informationen und Veröffentlichungen sind nicht als Finanz-, Anlage-, Handels- oder andere Arten von Ratschlägen oder Empfehlungen gedacht, die von TradingView bereitgestellt oder gebilligt werden, und stellen diese nicht dar. Lesen Sie mehr in den Nutzungsbedingungen.