Long
Update: Falling Wedge
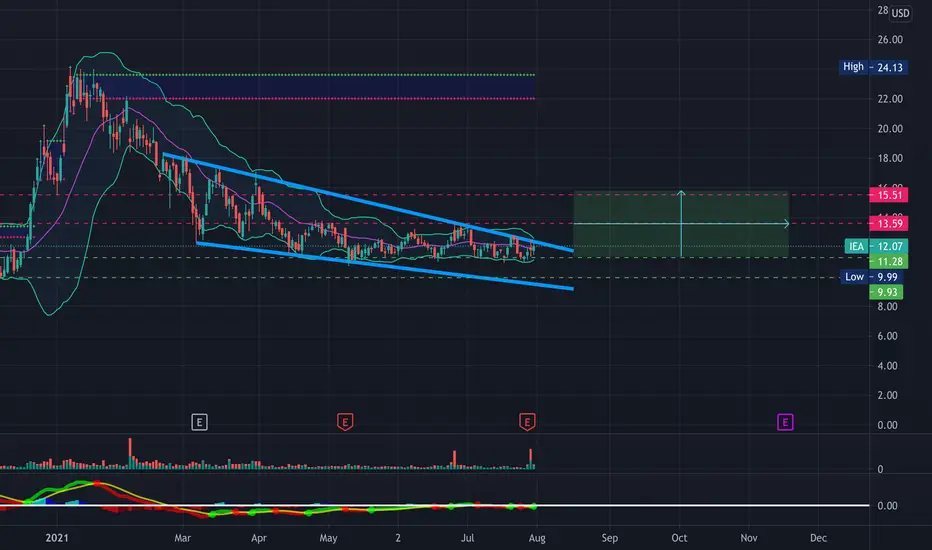
IEA is nearing the end of the symmetrical triangle previously charted. While still holding that formation is also forming what appears to be a falling wedge (bullish). Bollinger bands are squeezing along with a MACD cross to close on Friday. Just some support and resistance levels to watch, see previous chart & description for price targets. Bullish will be looking for a breakout-
--------------------
IEA has been consolidating in this triangle for quite some time now. Undoubtedly a long-term play has held its support and looks to have found a bottom, with volume should really pop
- Hidden bullish divergence on the RSI
- Bollinger Bands squeezing indicating a big move
- Buyer volume starting to pick up again
- Held support at the $11.28 level, has resistance circa $13.59 and $15.51
PT1- $13.65
PT2- $14.80
PT3- $15.75
Anmerkung
Price Target 1 reached ✅
Haftungsausschluss
Die Informationen und Veröffentlichungen sind nicht als Finanz-, Anlage-, Handels- oder andere Arten von Ratschlägen oder Empfehlungen gedacht, die von TradingView bereitgestellt oder gebilligt werden, und stellen diese nicht dar. Lesen Sie mehr in den Nutzungsbedingungen.
Haftungsausschluss
Die Informationen und Veröffentlichungen sind nicht als Finanz-, Anlage-, Handels- oder andere Arten von Ratschlägen oder Empfehlungen gedacht, die von TradingView bereitgestellt oder gebilligt werden, und stellen diese nicht dar. Lesen Sie mehr in den Nutzungsbedingungen.