
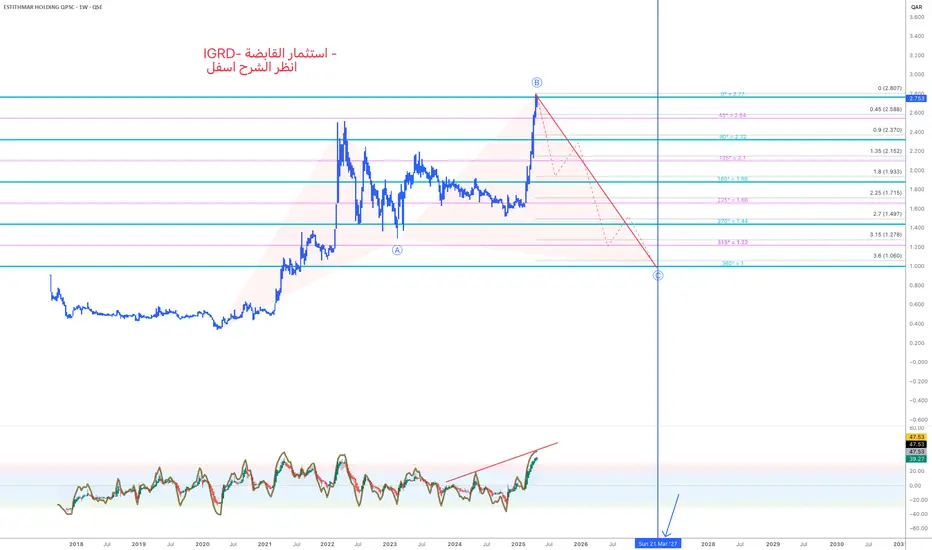
the chart shows a technical analysis of Estithmar Holding (IGRD) on a weekly timeframe, using Elliott Wave theory and Gann/Fibonacci angles to predict potential price movements.
Key Observations:
Elliott Wave Pattern – ABC Correction:
The chart suggests that the stock completed wave B at a recent high.
A downward corrective wave C is anticipated, as shown by the red dotted line.
Bearish Divergence:
At the bottom, a momentum oscillator (likely RSI or a similar indicator) shows bearish divergence – price is rising, but momentum is falling.
This is typically a warning signal that upside momentum is weakening.
Downside Price Targets (based on Gann/Fibonacci angles):
Possible support levels:
2.15 QAR
1.93 QAR
1.71 QAR
1.49 QAR
Final target: ~1.06 QAR (as the lowest projected level)
Warning Highlighted:
The red text at the top: "IGRD – Estithmar Holding – See explanation below"
This suggests a bearish outlook unless key resistance levels are broken with strong volume.
Summary:
Current trend: Overbought with signs of weakness.
Outlook: Bearish correction likely.
Action: Watch for confirmation of a downtrend or support at key Fibonacci/Gann levels.

Haftungsausschluss
Die Informationen und Veröffentlichungen sind nicht als Finanz-, Anlage-, Handels- oder andere Arten von Ratschlägen oder Empfehlungen gedacht, die von TradingView bereitgestellt oder gebilligt werden, und stellen diese nicht dar. Lesen Sie mehr in den Nutzungsbedingungen.
Haftungsausschluss
Die Informationen und Veröffentlichungen sind nicht als Finanz-, Anlage-, Handels- oder andere Arten von Ratschlägen oder Empfehlungen gedacht, die von TradingView bereitgestellt oder gebilligt werden, und stellen diese nicht dar. Lesen Sie mehr in den Nutzungsbedingungen.