
🔹 Key Technical Zones
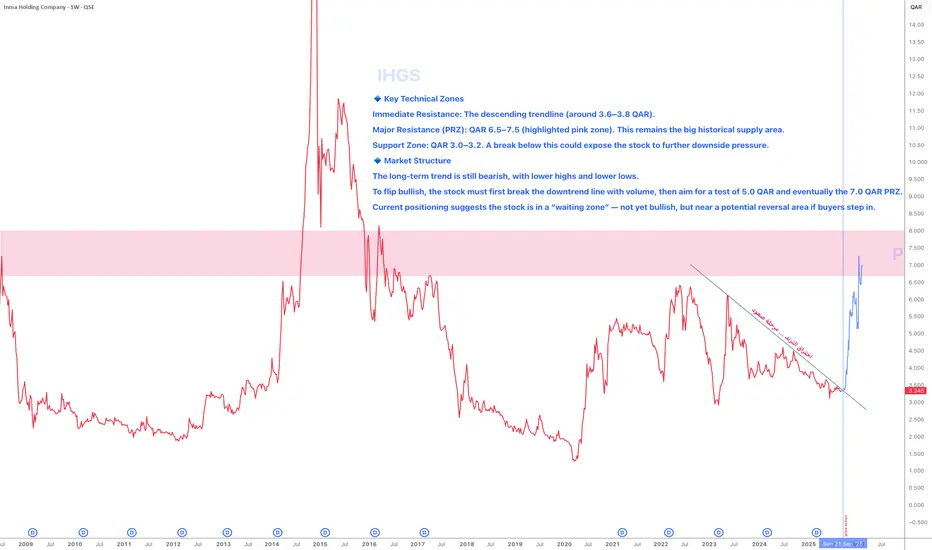
Immediate Resistance: The descending trendline (around 3.6–3.8 QAR).
Major Resistance (PRZ): QAR 6.5–7.5 (highlighted pink zone). This remains the big historical supply area.
Support Zone: QAR 3.0–3.2. A break below this could expose the stock to further downside pressure.
🔹 Market Structure
The long-term trend is still bearish, with lower highs and lower lows.
To flip bullish, the stock must first break the downtrend line with volume, then aim for a test of 5.0 QAR and eventually the 7.0 QAR PRZ.
Current positioning suggests the stock is in a “waiting zone” — not yet bullish, but near a potential reversal area if buyers step in.
Immediate Resistance: The descending trendline (around 3.6–3.8 QAR).
Major Resistance (PRZ): QAR 6.5–7.5 (highlighted pink zone). This remains the big historical supply area.
Support Zone: QAR 3.0–3.2. A break below this could expose the stock to further downside pressure.
🔹 Market Structure
The long-term trend is still bearish, with lower highs and lower lows.
To flip bullish, the stock must first break the downtrend line with volume, then aim for a test of 5.0 QAR and eventually the 7.0 QAR PRZ.
Current positioning suggests the stock is in a “waiting zone” — not yet bullish, but near a potential reversal area if buyers step in.

Haftungsausschluss
Die Informationen und Veröffentlichungen sind nicht als Finanz-, Anlage-, Handels- oder andere Arten von Ratschlägen oder Empfehlungen gedacht, die von TradingView bereitgestellt oder gebilligt werden, und stellen diese nicht dar. Lesen Sie mehr in den Nutzungsbedingungen.
Haftungsausschluss
Die Informationen und Veröffentlichungen sind nicht als Finanz-, Anlage-, Handels- oder andere Arten von Ratschlägen oder Empfehlungen gedacht, die von TradingView bereitgestellt oder gebilligt werden, und stellen diese nicht dar. Lesen Sie mehr in den Nutzungsbedingungen.