Long
Incent Can Offer You Incentive
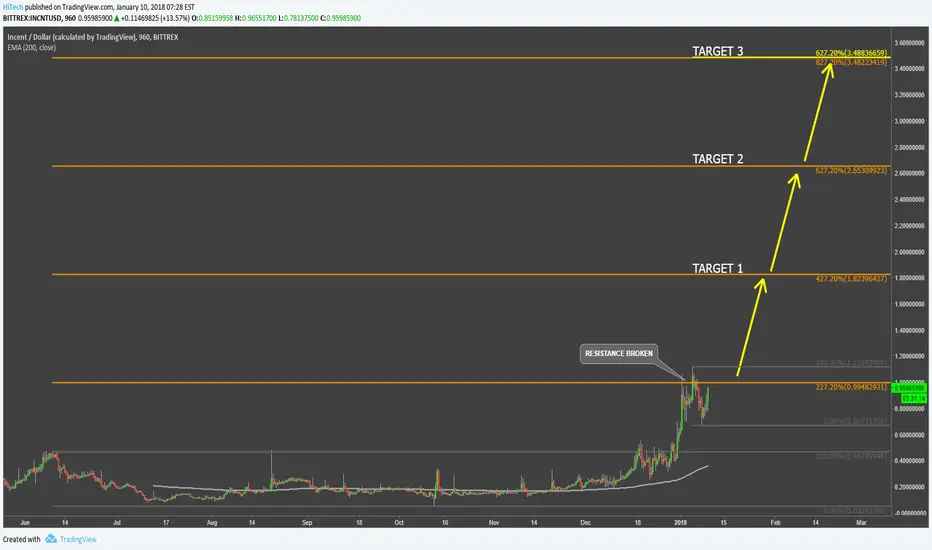
Incent has been ranging for an extended period of time although recently it has shown good performance while rising from $0.05 up to $1. Price established an all-time new high and it seems that the upside momentum is just getting stronger.
INCNT/USD broke above the 227.2% Fibonacci resistance and continues to trade above the 200 Moving Average. With the higher highs and higher lows being printed, the price is expected to rise up to one of the Fibonacci resistance levels, with the final target being at $3.48. Only break and close below the 200 MA could invalidate bullish outlook.
INCNT/USD broke above the 227.2% Fibonacci resistance and continues to trade above the 200 Moving Average. With the higher highs and higher lows being printed, the price is expected to rise up to one of the Fibonacci resistance levels, with the final target being at $3.48. Only break and close below the 200 MA could invalidate bullish outlook.

Haftungsausschluss
Die Informationen und Veröffentlichungen sind nicht als Finanz-, Anlage-, Handels- oder andere Arten von Ratschlägen oder Empfehlungen gedacht, die von TradingView bereitgestellt oder gebilligt werden, und stellen diese nicht dar. Lesen Sie mehr in den Nutzungsbedingungen.
Haftungsausschluss
Die Informationen und Veröffentlichungen sind nicht als Finanz-, Anlage-, Handels- oder andere Arten von Ratschlägen oder Empfehlungen gedacht, die von TradingView bereitgestellt oder gebilligt werden, und stellen diese nicht dar. Lesen Sie mehr in den Nutzungsbedingungen.