
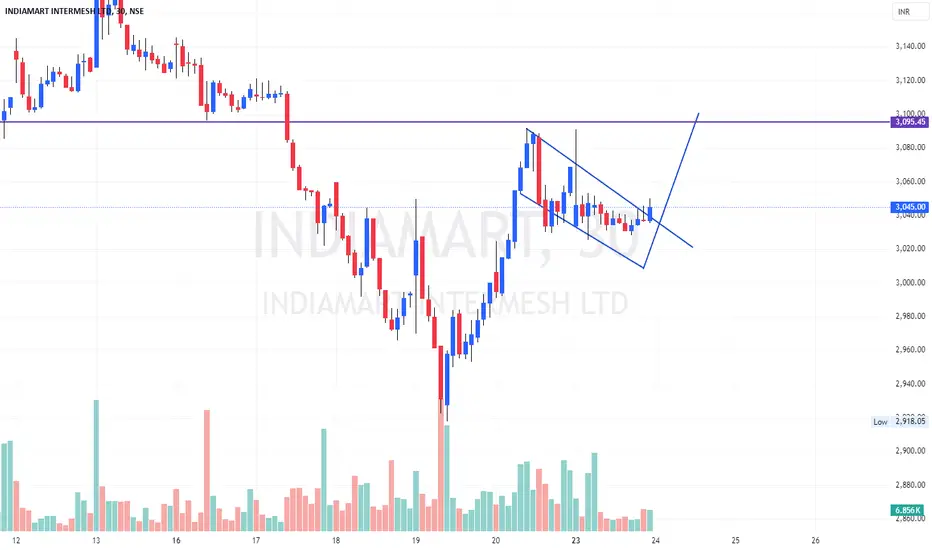
Bullish Flag Pattern: The chart displays a downward-sloping channel following a sharp upward movement, forming a bullish flag. This pattern suggests a potential continuation of the prior uptrend.
Price Action: The price is currently at 3,045.00, with a recent high around 3,095.45. The consolidation within the flag indicates a pause before a possible upward breakout.
Breakout Potential: The drawn line suggests an anticipated breakout to the upside. A breakout above the flag's upper boundary, especially with increased volume, would confirm the bullish continuation.
Resistance Level: A resistance level is marked at 3,100.00. A successful breakout above this level could lead to further upward movement.
Volume Analysis: The volume bars show moderate activity. An increase in volume during a breakout would provide stronger confirmation of the move.
Trading Strategy: Consider entering a long position upon a confirmed breakout above the flag and resistance level, with a target set above 3,100.00. Use a stop-loss below the lower boundary of the flag to manage risk.
Not So much confident in this stock. for learning purposes only.
Price Action: The price is currently at 3,045.00, with a recent high around 3,095.45. The consolidation within the flag indicates a pause before a possible upward breakout.
Breakout Potential: The drawn line suggests an anticipated breakout to the upside. A breakout above the flag's upper boundary, especially with increased volume, would confirm the bullish continuation.
Resistance Level: A resistance level is marked at 3,100.00. A successful breakout above this level could lead to further upward movement.
Volume Analysis: The volume bars show moderate activity. An increase in volume during a breakout would provide stronger confirmation of the move.
Trading Strategy: Consider entering a long position upon a confirmed breakout above the flag and resistance level, with a target set above 3,100.00. Use a stop-loss below the lower boundary of the flag to manage risk.
Not So much confident in this stock. for learning purposes only.
Anmerkung
SL hit
Haftungsausschluss
Die Informationen und Veröffentlichungen sind nicht als Finanz-, Anlage-, Handels- oder andere Arten von Ratschlägen oder Empfehlungen gedacht, die von TradingView bereitgestellt oder gebilligt werden, und stellen diese nicht dar. Lesen Sie mehr in den Nutzungsbedingungen.
Haftungsausschluss
Die Informationen und Veröffentlichungen sind nicht als Finanz-, Anlage-, Handels- oder andere Arten von Ratschlägen oder Empfehlungen gedacht, die von TradingView bereitgestellt oder gebilligt werden, und stellen diese nicht dar. Lesen Sie mehr in den Nutzungsbedingungen.