
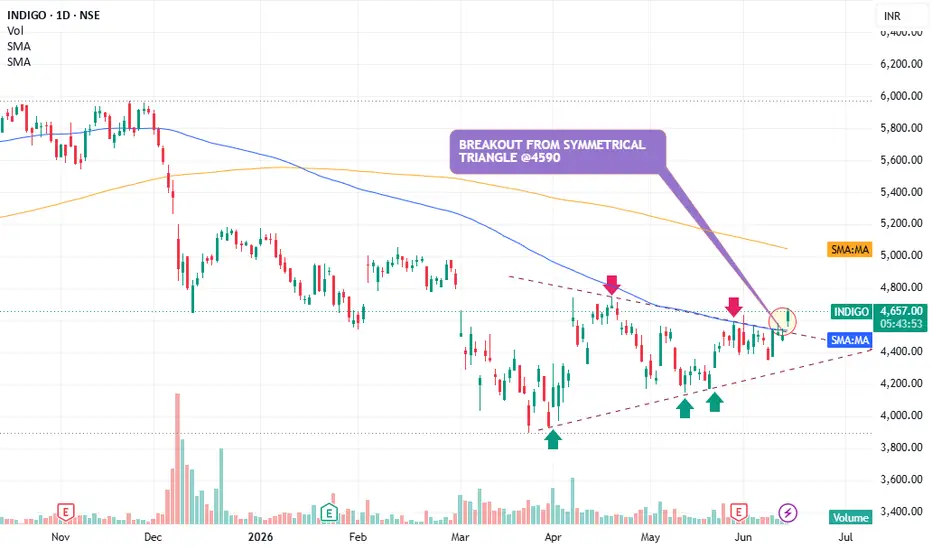
INDIGO (Daily Chart) – Technical Analysis
The chart shows a bullish breakout from a Symmetrical Triangle pattern, indicating that the consolidation phase may be ending and a fresh uptrend could be begin.
Key Observations
📈 1. Symmetrical Triangle Formation
Price has been making lower highs and higher lows since March.
This created a Symmetrical Triangle, showing a balance between buyers and sellers.
Such patterns usually lead to a strong move after breakout.
📈 2. Breakout Around ₹4,590
Price has broken above the triangle's upper trendline near ₹4,590.
The breakout is highlighted on the chart.
Current price is around ₹4,656, confirming strength above the breakout zone.
📈 3. Moving Average Support
The stock has moved above the 50-DMA (Blue Line) around ₹4,537.
The 50-DMA is now acting as immediate support.
Price sustaining above the 50-DMA is a positive sign.
📈 4. Higher Lows Formation
Green arrows indicate buyers stepping in at higher levels.
This reflects accumulation and strengthening demand.
📈 5. Volume Confirmation
Volume has improved during the breakout.
Strong volume adds credibility to the breakout and reduces the probability of a false move.
The chart shows a bullish breakout from a Symmetrical Triangle pattern, indicating that the consolidation phase may be ending and a fresh uptrend could be begin.
Key Observations
📈 1. Symmetrical Triangle Formation
Price has been making lower highs and higher lows since March.
This created a Symmetrical Triangle, showing a balance between buyers and sellers.
Such patterns usually lead to a strong move after breakout.
📈 2. Breakout Around ₹4,590
Price has broken above the triangle's upper trendline near ₹4,590.
The breakout is highlighted on the chart.
Current price is around ₹4,656, confirming strength above the breakout zone.
📈 3. Moving Average Support
The stock has moved above the 50-DMA (Blue Line) around ₹4,537.
The 50-DMA is now acting as immediate support.
Price sustaining above the 50-DMA is a positive sign.
📈 4. Higher Lows Formation
Green arrows indicate buyers stepping in at higher levels.
This reflects accumulation and strengthening demand.
📈 5. Volume Confirmation
Volume has improved during the breakout.
Strong volume adds credibility to the breakout and reduces the probability of a false move.

Haftungsausschluss
Die Informationen und Veröffentlichungen sind nicht als Finanz-, Anlage-, Handels- oder andere Arten von Ratschlägen oder Empfehlungen gedacht, die von TradingView bereitgestellt oder gebilligt werden, und stellen diese nicht dar. Lesen Sie mehr in den Nutzungsbedingungen.
Haftungsausschluss
Die Informationen und Veröffentlichungen sind nicht als Finanz-, Anlage-, Handels- oder andere Arten von Ratschlägen oder Empfehlungen gedacht, die von TradingView bereitgestellt oder gebilligt werden, und stellen diese nicht dar. Lesen Sie mehr in den Nutzungsbedingungen.