
IONQ – Potential Bounce From Support
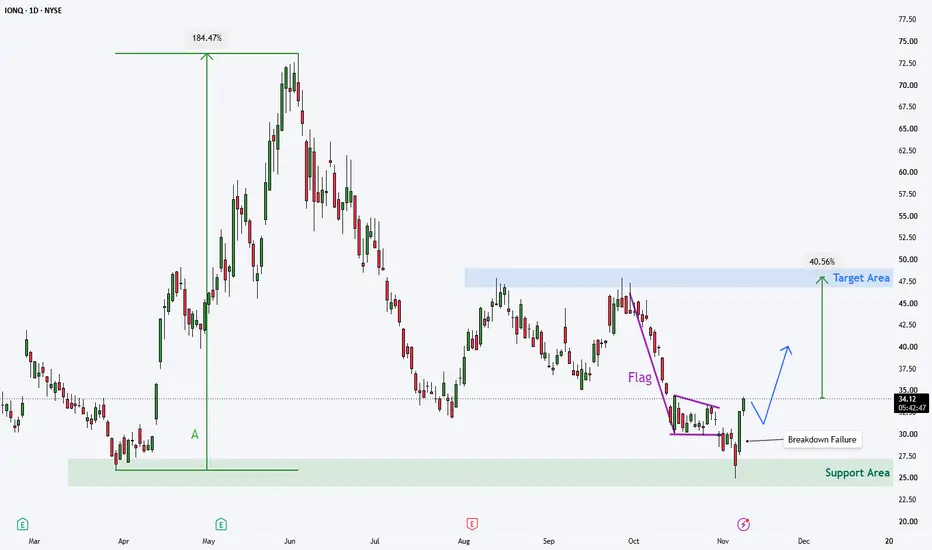
The last time the stock traded around the $26 level, it went on to deliver a 184% rally (A). Since then, the price has not revisited this level, suggesting that it could now act as support.
Looking at the chart, we can see that the price broke down from a Flag formation but made very little downside progress before reversing back to the upside. This potentially created a Breakdown Failure setup.
We therefore have several bullish factors coming together:
- A well-established support area around $26.
- A potential Breakdown Failure following the Flag breakdown.
- A relatively large green candle showing a strong buying response to the decline.
Taking all these factors into account, I believe the stock could easily move higher toward the $48 level, representing approximately 41% upside from the current price.

Haftungsausschluss
Die Informationen und Veröffentlichungen sind nicht als Finanz-, Anlage-, Handels- oder andere Arten von Ratschlägen oder Empfehlungen gedacht, die von TradingView bereitgestellt oder gebilligt werden, und stellen diese nicht dar. Lesen Sie mehr in den Nutzungsbedingungen.
Haftungsausschluss
Die Informationen und Veröffentlichungen sind nicht als Finanz-, Anlage-, Handels- oder andere Arten von Ratschlägen oder Empfehlungen gedacht, die von TradingView bereitgestellt oder gebilligt werden, und stellen diese nicht dar. Lesen Sie mehr in den Nutzungsbedingungen.