
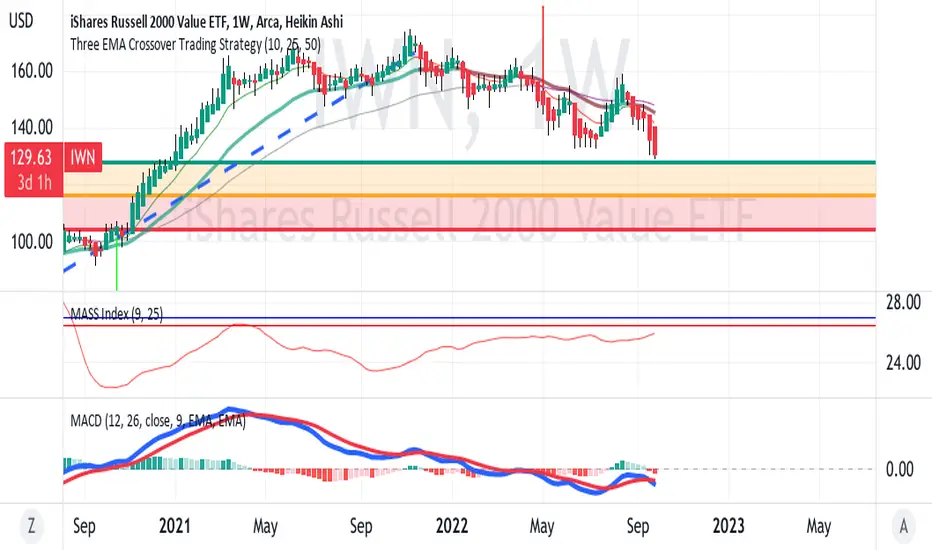
IWN as shown on the weekly chart has been obviously in a downtrend as also shown by
the EMA ribbon.
Using the uptrend from the Covid crash into November 2021 and then a retracement from that,
IWN is approchaing the 38.2 Fibonacci level at 128
From there it could bounce up or continue the downtrend.
The Mass Index being below 27 suggests a continuation before any potential reversal.
The MACD indicator shows the MACD in blue crossing down on the signal in red.
This also suggests more downtrend.
All in all, this analysis is bearish on the Russell index and its ETF.

Haftungsausschluss
Die Informationen und Veröffentlichungen sind nicht als Finanz-, Anlage-, Handels- oder andere Arten von Ratschlägen oder Empfehlungen gedacht, die von TradingView bereitgestellt oder gebilligt werden, und stellen diese nicht dar. Lesen Sie mehr in den Nutzungsbedingungen.
Haftungsausschluss
Die Informationen und Veröffentlichungen sind nicht als Finanz-, Anlage-, Handels- oder andere Arten von Ratschlägen oder Empfehlungen gedacht, die von TradingView bereitgestellt oder gebilligt werden, und stellen diese nicht dar. Lesen Sie mehr in den Nutzungsbedingungen.