
Good evening?
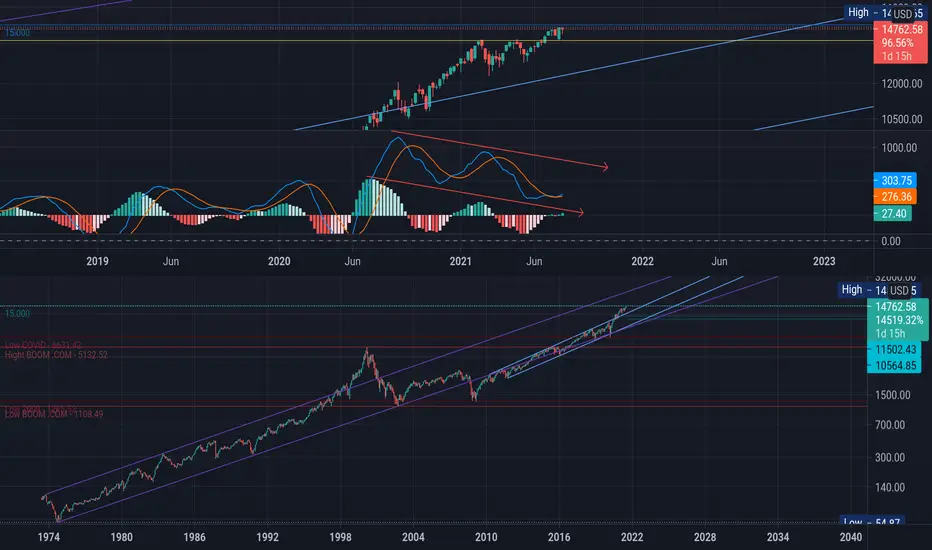
Signals to sell NASDAQ in general and BigTech shares in particular:
1. Round price of $ 15,000 = resistance.
2. Strong bearish MACD divergence on the weekly chart.
3. Beginning of bearish MACD divergence on slower monthly chart.
4. Bull trap - upward breakout of the resistance of the double top (yellow line).
Therefore, we can expect a Fibonacci correction from 30-50% to the $ 11.5k-10.5k range.
Not a financial recommendation.
GET RICH OR DIE TRYIN.
Signals to sell NASDAQ in general and BigTech shares in particular:
1. Round price of $ 15,000 = resistance.
2. Strong bearish MACD divergence on the weekly chart.
3. Beginning of bearish MACD divergence on slower monthly chart.
4. Bull trap - upward breakout of the resistance of the double top (yellow line).
Therefore, we can expect a Fibonacci correction from 30-50% to the $ 11.5k-10.5k range.
Not a financial recommendation.
GET RICH OR DIE TRYIN.

Haftungsausschluss
Die Informationen und Veröffentlichungen sind nicht als Finanz-, Anlage-, Handels- oder andere Arten von Ratschlägen oder Empfehlungen gedacht, die von TradingView bereitgestellt oder gebilligt werden, und stellen diese nicht dar. Lesen Sie mehr in den Nutzungsbedingungen.
Haftungsausschluss
Die Informationen und Veröffentlichungen sind nicht als Finanz-, Anlage-, Handels- oder andere Arten von Ratschlägen oder Empfehlungen gedacht, die von TradingView bereitgestellt oder gebilligt werden, und stellen diese nicht dar. Lesen Sie mehr in den Nutzungsbedingungen.