Tony's Picks
I have recently started analyzing charts and have come across this interesting idea.
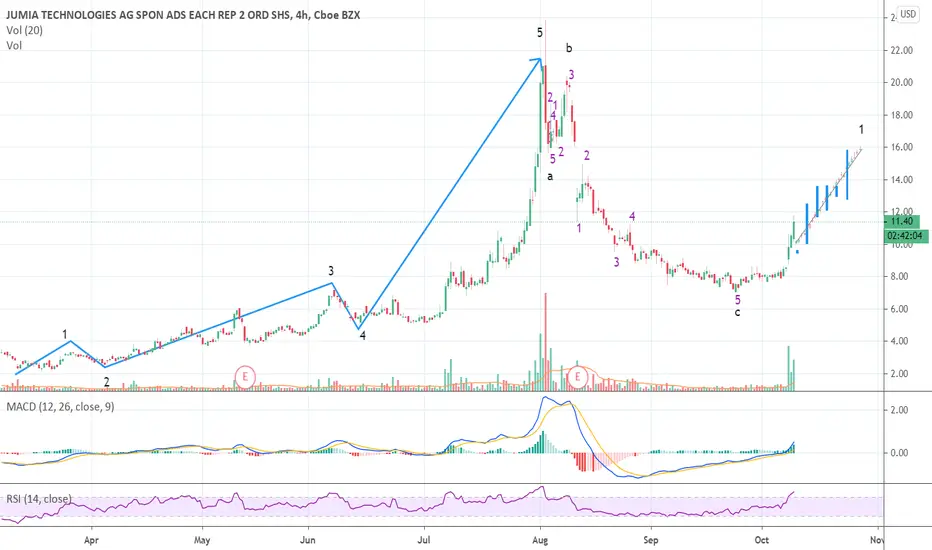
This chart is on the 4hr time frame. It looks like JMIA is about to enter wave 1 after a 5-3-5 zig zag countertrend according to the Elliot wave theory. This idea assumes everything prior to this trend was just an IPO countertrend. Wave 2 two bounces off the .618 from wave 1 fib retracement perfectly. On the weekly chart it could be argued that we are still in one large wave 1 on macro level. I could see a $16 price target being realistic based off this chart. Expect volatility as JMIA still has a lot to prove.
Curious to thoughts and comments.
Thank you.
I have recently started analyzing charts and have come across this interesting idea.
This chart is on the 4hr time frame. It looks like
JMIA is about to enter wave 1 after a 5-3-5 zig zag countertrend according to the Elliot wave theory. This idea assumes everything prior to this trend was just an IPO countertrend. Wave 2 two bounces off the .618 from wave 1 fib retracement perfectly. On the weekly chart it could be argued that we are still in one large wave 1 on macro level. I could see a $16 price target being realistic based off this chart. Expect volatility as JMIA still has a lot to prove. Curious to thoughts and comments.
Thank you.

Haftungsausschluss
Die Informationen und Veröffentlichungen sind nicht als Finanz-, Anlage-, Handels- oder andere Arten von Ratschlägen oder Empfehlungen gedacht, die von TradingView bereitgestellt oder gebilligt werden, und stellen diese nicht dar. Lesen Sie mehr in den Nutzungsbedingungen.
Haftungsausschluss
Die Informationen und Veröffentlichungen sind nicht als Finanz-, Anlage-, Handels- oder andere Arten von Ratschlägen oder Empfehlungen gedacht, die von TradingView bereitgestellt oder gebilligt werden, und stellen diese nicht dar. Lesen Sie mehr in den Nutzungsbedingungen.