

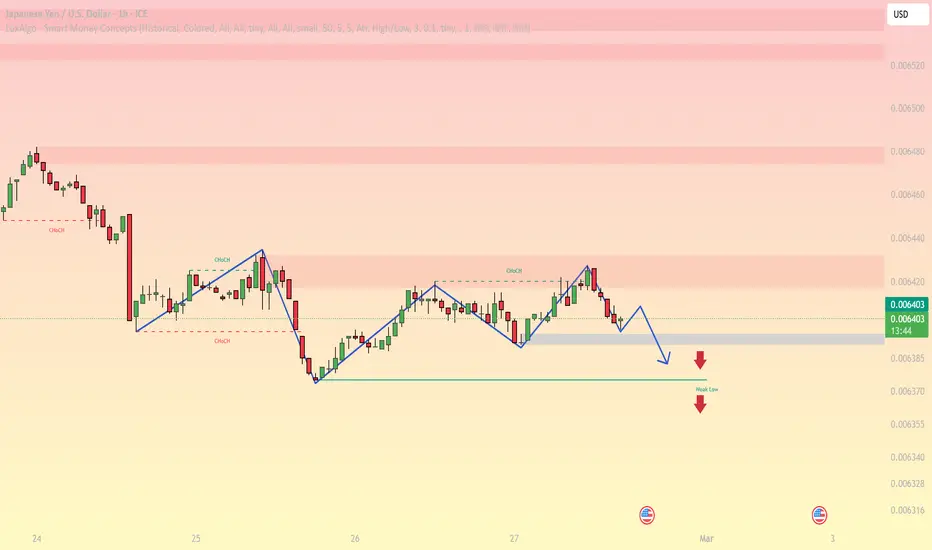
JPYUSD 1H: Lower-High Structure Under Supply, Downside Favored Toward Weak Low
JPYUSD is printing a clean range-to-distribution profile on the 1H chart. After the sharp selloff, price attempted multiple recoveries but keeps forming lower highs into a light supply band, while the market holds a fragile base. This keeps the bias bearish unless price reclaims the last swing high and holds above supply.
Structure and Trendline Read
The recent rally into the right-side peak failed and rolled over, creating another lower high.
The current micro structure suggests sell pressure is absorbing upside, especially near the gray supply pocket.
A simple descending trendline from the last two swing highs acts as dynamic resistance. As long as price stays below it, rallies are likely to be sold.
Key Levels (Support and Resistance)
Resistance Zones
0.00641–0.00643: immediate reaction zone (current overhead friction).
0.00646–0.00648: higher supply band; a clean reclaim would weaken the bearish case.
Support Zones
0.00639–0.006385: first breakdown trigger (range floor).
0.00637–0.00636 (Weak Low): main downside magnet if the floor breaks.
0.00634–0.00632: deeper support only in a momentum expansion.
Fibonacci Confluence
If you anchor Fibonacci from the last swing high (right-side peak) down to the range low:
The 0.50–0.618 retracement typically aligns with the 0.00641–0.00643 area.
That makes this zone a high-quality sell-the-rally region if price taps it and rejects.
EMA and RSI Filters (Optional but Useful)
EMA 50 (1H): bearish when price stays below EMA50 and EMA50 flattens/turns down.
RSI 14: bearish control when RSI fails to reclaim 50 on rallies. If RSI holds above 50, downside setups become lower quality.
Trading Scenarios
Scenario A: Sell the Rally Into Resistance (Primary Plan)
Entry idea: sell rejection at 0.00641–0.00643, or higher at 0.00646–0.00648
Invalidation: sustained 1H close above the supply band
Targets:
TP1 0.00639–0.006385
TP2 0.00637–0.00636 (weak low)
Best confirmation: a clear rejection candle and failure to reclaim the trendline.
Scenario B: Breakdown + Retest (Clean Confirmation)
Trigger: 1H close below 0.00639–0.006385
Entry idea: sell the retest (support flips to resistance)
Targets: 0.00637–0.00636, then deeper only if momentum expands.
Scenario C: Bullish Invalidation (Only if Structure Flips)
Trigger: break and hold above 0.00646–0.00648 plus a higher low on retest
This would shift the market back into a range rotation or upside expansion.
Execution Note
This is a mid-range market. The best trades come from the edges: selling into resistance or selling the confirmed breakdown, not chasing in the middle.
JPYUSD is printing a clean range-to-distribution profile on the 1H chart. After the sharp selloff, price attempted multiple recoveries but keeps forming lower highs into a light supply band, while the market holds a fragile base. This keeps the bias bearish unless price reclaims the last swing high and holds above supply.
Structure and Trendline Read
The recent rally into the right-side peak failed and rolled over, creating another lower high.
The current micro structure suggests sell pressure is absorbing upside, especially near the gray supply pocket.
A simple descending trendline from the last two swing highs acts as dynamic resistance. As long as price stays below it, rallies are likely to be sold.
Key Levels (Support and Resistance)
Resistance Zones
0.00641–0.00643: immediate reaction zone (current overhead friction).
0.00646–0.00648: higher supply band; a clean reclaim would weaken the bearish case.
Support Zones
0.00639–0.006385: first breakdown trigger (range floor).
0.00637–0.00636 (Weak Low): main downside magnet if the floor breaks.
0.00634–0.00632: deeper support only in a momentum expansion.
Fibonacci Confluence
If you anchor Fibonacci from the last swing high (right-side peak) down to the range low:
The 0.50–0.618 retracement typically aligns with the 0.00641–0.00643 area.
That makes this zone a high-quality sell-the-rally region if price taps it and rejects.
EMA and RSI Filters (Optional but Useful)
EMA 50 (1H): bearish when price stays below EMA50 and EMA50 flattens/turns down.
RSI 14: bearish control when RSI fails to reclaim 50 on rallies. If RSI holds above 50, downside setups become lower quality.
Trading Scenarios
Scenario A: Sell the Rally Into Resistance (Primary Plan)
Entry idea: sell rejection at 0.00641–0.00643, or higher at 0.00646–0.00648
Invalidation: sustained 1H close above the supply band
Targets:
TP1 0.00639–0.006385
TP2 0.00637–0.00636 (weak low)
Best confirmation: a clear rejection candle and failure to reclaim the trendline.
Scenario B: Breakdown + Retest (Clean Confirmation)
Trigger: 1H close below 0.00639–0.006385
Entry idea: sell the retest (support flips to resistance)
Targets: 0.00637–0.00636, then deeper only if momentum expands.
Scenario C: Bullish Invalidation (Only if Structure Flips)
Trigger: break and hold above 0.00646–0.00648 plus a higher low on retest
This would shift the market back into a range rotation or upside expansion.
Execution Note
This is a mid-range market. The best trades come from the edges: selling into resistance or selling the confirmed breakdown, not chasing in the middle.

🪙 JOIN OUR FREE TELEGRAM GROUP 🪙
t.me/dnaprofits
Join the community group to get support and share knowledge!
️🥇 Exchange and learn market knowledge
️🥇 Support free trading signals
t.me/dnaprofits
Join the community group to get support and share knowledge!
️🥇 Exchange and learn market knowledge
️🥇 Support free trading signals
Haftungsausschluss
Die Informationen und Veröffentlichungen sind nicht als Finanz-, Anlage-, Handels- oder andere Arten von Ratschlägen oder Empfehlungen gedacht, die von TradingView bereitgestellt oder gebilligt werden, und stellen diese nicht dar. Lesen Sie mehr in den Nutzungsbedingungen.
🪙 JOIN OUR FREE TELEGRAM GROUP 🪙
t.me/dnaprofits
Join the community group to get support and share knowledge!
️🥇 Exchange and learn market knowledge
️🥇 Support free trading signals
t.me/dnaprofits
Join the community group to get support and share knowledge!
️🥇 Exchange and learn market knowledge
️🥇 Support free trading signals
Haftungsausschluss
Die Informationen und Veröffentlichungen sind nicht als Finanz-, Anlage-, Handels- oder andere Arten von Ratschlägen oder Empfehlungen gedacht, die von TradingView bereitgestellt oder gebilligt werden, und stellen diese nicht dar. Lesen Sie mehr in den Nutzungsbedingungen.