
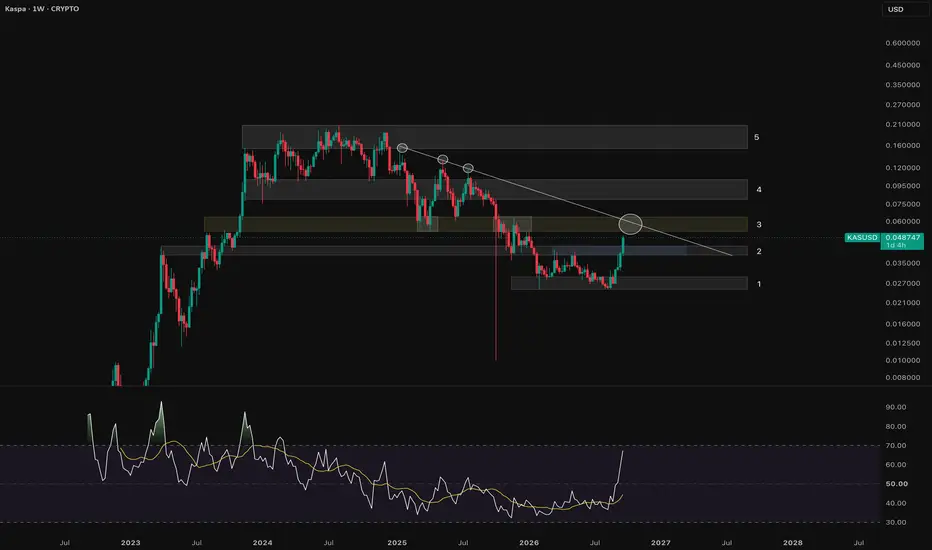
1 — ~$0.025–$0.030: Major support / accumulation area
This is the bottom gray box.
KAS spent quite a bit of time consolidating here after the decline. Price repeatedly held roughly $0.026–$0.028, and the recent rally appears to have launched from this area.
The implication is that Zone 1 is the current structural floor. If this rally completely fails, this is the major area you'd watch for buyers to step back in.
2 — ~$0.039–$0.045: First resistance — now being broken
This is particularly important because KAS has just pushed through Zone 2.
The chart shows a large green candle carrying KAS from the upper $0.03s through the ~$0.04 resistance area and up to approximately $0.049.
So the question becomes whether KAS can hold above Zone 2.
A pullback into roughly $0.040–$0.044 followed by buyers stepping in would be constructive because former resistance would be acting as new support.
3 — ~$0.052–$0.064: The big test
This is where the chart gets much more interesting.
Zone 3 is roughly 5.2–6.4 cents, and the descending trendline is coming directly into this region.
That means KAS potentially has two forms of resistance converging in the same place:
horizontal resistance + the long-term descending trendline.
At $0.0489, KAS is already fairly close to it. The bottom of the zone is only about 6% higher, while ~$0.060 would be about 23% higher.
A decisive move through Zone 3 and that descending trendline would represent a much more meaningful technical change than simply breaking Zone 2.
4 — ~$0.080–$0.105: Major overhead resistance
If KAS eventually gets through Zone 3, this chart identifies Zone 4 as the next substantial area where sellers could appear.
This roughly corresponds to an old trading region around $0.08–$0.10.
From today's ~$0.049 price:
- $0.08 ≈ +64%
- $0.095 ≈ +94%
- $0.10 ≈ +105%
So there is a significant gap between Zones 3 and 4 if the chart's structure plays out.
5 — ~$0.15–$0.21: Major long-term resistance
Zone 5 represents the old high-price distribution/resistance area.
You can see that KAS spent considerable time between roughly $0.15 and $0.20 before the major downtrend developed.
Getting back here would therefore be a much larger accomplishment. From $0.0489:
$0.15 = ~3.1×
$0.16 = ~3.3×
$0.20 = ~4.1×
But there's a lot of technical work between the current price and that region.
This is the bottom gray box.
KAS spent quite a bit of time consolidating here after the decline. Price repeatedly held roughly $0.026–$0.028, and the recent rally appears to have launched from this area.
The implication is that Zone 1 is the current structural floor. If this rally completely fails, this is the major area you'd watch for buyers to step back in.
2 — ~$0.039–$0.045: First resistance — now being broken
This is particularly important because KAS has just pushed through Zone 2.
The chart shows a large green candle carrying KAS from the upper $0.03s through the ~$0.04 resistance area and up to approximately $0.049.
So the question becomes whether KAS can hold above Zone 2.
A pullback into roughly $0.040–$0.044 followed by buyers stepping in would be constructive because former resistance would be acting as new support.
3 — ~$0.052–$0.064: The big test
This is where the chart gets much more interesting.
Zone 3 is roughly 5.2–6.4 cents, and the descending trendline is coming directly into this region.
That means KAS potentially has two forms of resistance converging in the same place:
horizontal resistance + the long-term descending trendline.
At $0.0489, KAS is already fairly close to it. The bottom of the zone is only about 6% higher, while ~$0.060 would be about 23% higher.
A decisive move through Zone 3 and that descending trendline would represent a much more meaningful technical change than simply breaking Zone 2.
4 — ~$0.080–$0.105: Major overhead resistance
If KAS eventually gets through Zone 3, this chart identifies Zone 4 as the next substantial area where sellers could appear.
This roughly corresponds to an old trading region around $0.08–$0.10.
From today's ~$0.049 price:
- $0.08 ≈ +64%
- $0.095 ≈ +94%
- $0.10 ≈ +105%
So there is a significant gap between Zones 3 and 4 if the chart's structure plays out.
5 — ~$0.15–$0.21: Major long-term resistance
Zone 5 represents the old high-price distribution/resistance area.
You can see that KAS spent considerable time between roughly $0.15 and $0.20 before the major downtrend developed.
Getting back here would therefore be a much larger accomplishment. From $0.0489:
$0.15 = ~3.1×
$0.16 = ~3.3×
$0.20 = ~4.1×
But there's a lot of technical work between the current price and that region.

Haftungsausschluss
Die Informationen und Veröffentlichungen sind nicht als Finanz-, Anlage-, Handels- oder andere Arten von Ratschlägen oder Empfehlungen gedacht, die von TradingView bereitgestellt oder gebilligt werden, und stellen diese nicht dar. Lesen Sie mehr in den Nutzungsbedingungen.
Haftungsausschluss
Die Informationen und Veröffentlichungen sind nicht als Finanz-, Anlage-, Handels- oder andere Arten von Ratschlägen oder Empfehlungen gedacht, die von TradingView bereitgestellt oder gebilligt werden, und stellen diese nicht dar. Lesen Sie mehr in den Nutzungsbedingungen.