
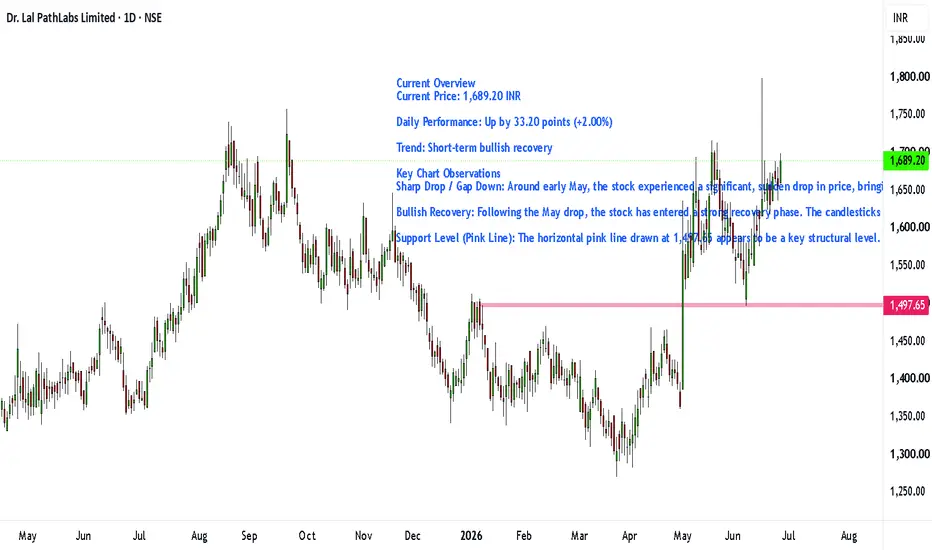
Current Overview
Current Price: 1,689.20 INR
Daily Performance: Up by 33.20 points (+2.00%)
Trend: Short-term bullish recovery
Key Chart Observations
Sharp Drop / Gap Down: Around early May, the stock experienced a significant, sudden drop in price, bringing it down sharply from the 1,600+ levels to near the 1,400 levels.
Bullish Recovery: Following the May drop, the stock has entered a strong recovery phase. The candlesticks show a steady uptrend characterized by a series of higher highs and higher lows, indicating sustained buying pressure.
Support Level (Pink Line): The horizontal pink line drawn at 1,497.65 appears to be a key structural level. The price briefly consolidated near this area before aggressively pushing higher, suggesting it acts as a strong support zone.
Current Price: 1,689.20 INR
Daily Performance: Up by 33.20 points (+2.00%)
Trend: Short-term bullish recovery
Key Chart Observations
Sharp Drop / Gap Down: Around early May, the stock experienced a significant, sudden drop in price, bringing it down sharply from the 1,600+ levels to near the 1,400 levels.
Bullish Recovery: Following the May drop, the stock has entered a strong recovery phase. The candlesticks show a steady uptrend characterized by a series of higher highs and higher lows, indicating sustained buying pressure.
Support Level (Pink Line): The horizontal pink line drawn at 1,497.65 appears to be a key structural level. The price briefly consolidated near this area before aggressively pushing higher, suggesting it acts as a strong support zone.

Automated Tools/Indicators/Screeners available at kkonline.org/nimblrta
Haftungsausschluss
Die Informationen und Veröffentlichungen sind nicht als Finanz-, Anlage-, Handels- oder andere Arten von Ratschlägen oder Empfehlungen gedacht, die von TradingView bereitgestellt oder gebilligt werden, und stellen diese nicht dar. Lesen Sie mehr in den Nutzungsbedingungen.
Automated Tools/Indicators/Screeners available at kkonline.org/nimblrta
Haftungsausschluss
Die Informationen und Veröffentlichungen sind nicht als Finanz-, Anlage-, Handels- oder andere Arten von Ratschlägen oder Empfehlungen gedacht, die von TradingView bereitgestellt oder gebilligt werden, und stellen diese nicht dar. Lesen Sie mehr in den Nutzungsbedingungen.