Long
LISK GOES UP
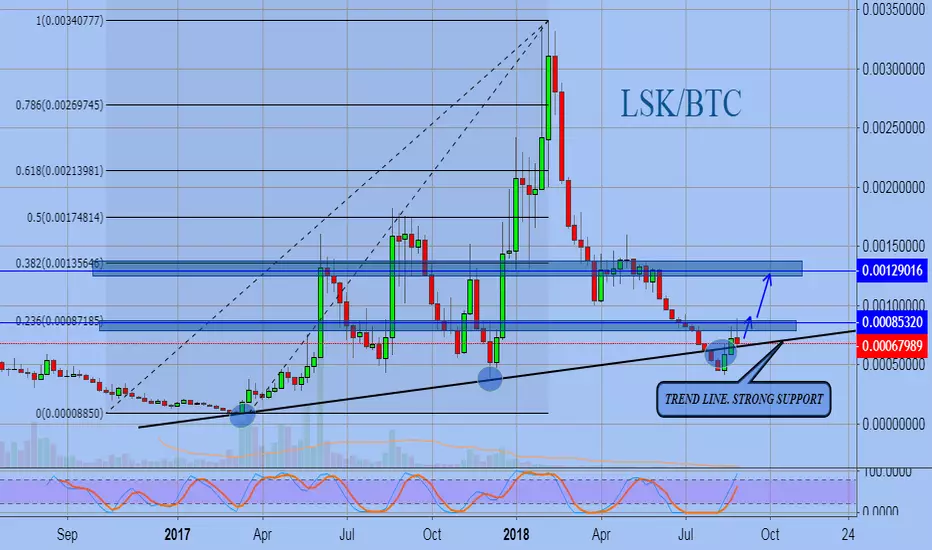
LISK is at the trend line, the chart shows the areas of contact of the support line. During the last touch, the trend line broke through, but the asset quickly returned to the growth zone.
Now the LISK is testing the support line, and then, with a high probability, it has grown at least to the 0.236 and 0.382 of the last asset growth.
Zone of resistance indicated.
Take profit - blue horizontal line
Now the LISK is testing the support line, and then, with a high probability, it has grown at least to the 0.236 and 0.382 of the last asset growth.
Zone of resistance indicated.
Take profit - blue horizontal line

Haftungsausschluss
Die Informationen und Veröffentlichungen sind nicht als Finanz-, Anlage-, Handels- oder andere Arten von Ratschlägen oder Empfehlungen gedacht, die von TradingView bereitgestellt oder gebilligt werden, und stellen diese nicht dar. Lesen Sie mehr in den Nutzungsbedingungen.
Haftungsausschluss
Die Informationen und Veröffentlichungen sind nicht als Finanz-, Anlage-, Handels- oder andere Arten von Ratschlägen oder Empfehlungen gedacht, die von TradingView bereitgestellt oder gebilligt werden, und stellen diese nicht dar. Lesen Sie mehr in den Nutzungsbedingungen.