
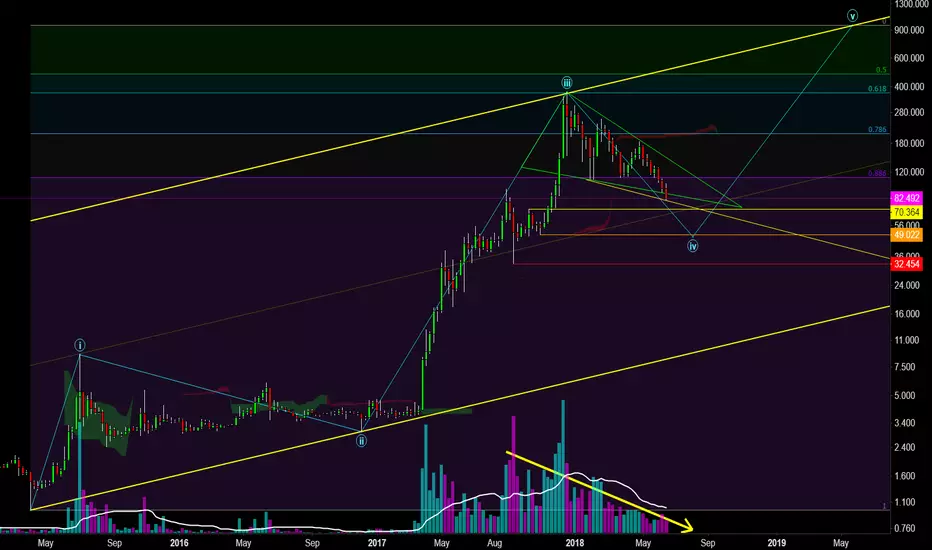
First off, thank you for taking the time to read this analysis. Now that I am using Bitfinex to chart, because it has the most history we can see the full picture on LTC. The ATH completed its Primary Wave 3 with the previous Wave 4 of lesser degree (where a corrective wave typically retraces to) falling in the range between $70-$32.
Volume has steadily declined since the ATH in an exhaustion of selling pressure, suggesting that it is approaching a bottoming range. While the price may trend sideways for sometime, the guideline of alternation between waves 2 and 4 would imply that as Wave 2 was sideways (uncharacteristic of Wave 2's), this corrective wave, if it is Wave 4, would be sharp and of shorter duration.
A Fibonacci Retracement tool set from the ATH to the ATL puts the current weeks price at the 0.786 (below), and while this would make sense for a bottom, I do not believe that BTC has found its bottom just yet, and we all know that where bitcoin goes, litecoin follows.

Weekly RSI and MACD show no signs of reaching a bottom here (below).

And while Godmode on the Weekly has fired Long (below) for the first time sine the beginning of the correction, we are looking for the blue line to turn up and touch the purple line for a reversal.

Drawing a channel on the weekly I have placed the top of Wave 5 at a price of $950. Wave 5 could be extended, which would be most likely coinciding with a major BTC bull run and the advancement in crypto market awareness, dismissing 950 or it could be truncated. Only the arrogant and people with crystal balls have that answer- I do not. But setting a Fibonacci Retracement tool at that 950 mark puts the double bottom bounces at the 0.886 level, which I am okay with.
Its YOUR money. YOU are an ADULT. Make YOUR OWN decisions. DYOR.
Volume has steadily declined since the ATH in an exhaustion of selling pressure, suggesting that it is approaching a bottoming range. While the price may trend sideways for sometime, the guideline of alternation between waves 2 and 4 would imply that as Wave 2 was sideways (uncharacteristic of Wave 2's), this corrective wave, if it is Wave 4, would be sharp and of shorter duration.
A Fibonacci Retracement tool set from the ATH to the ATL puts the current weeks price at the 0.786 (below), and while this would make sense for a bottom, I do not believe that BTC has found its bottom just yet, and we all know that where bitcoin goes, litecoin follows.
Weekly RSI and MACD show no signs of reaching a bottom here (below).
And while Godmode on the Weekly has fired Long (below) for the first time sine the beginning of the correction, we are looking for the blue line to turn up and touch the purple line for a reversal.
Drawing a channel on the weekly I have placed the top of Wave 5 at a price of $950. Wave 5 could be extended, which would be most likely coinciding with a major BTC bull run and the advancement in crypto market awareness, dismissing 950 or it could be truncated. Only the arrogant and people with crystal balls have that answer- I do not. But setting a Fibonacci Retracement tool at that 950 mark puts the double bottom bounces at the 0.886 level, which I am okay with.
Its YOUR money. YOU are an ADULT. Make YOUR OWN decisions. DYOR.
Anmerkung
Anmerkung
Anmerkung
Set your buys...
Anmerkung
Weekly Godmode Fired Long and crossed for a buy signal...this does not mean the end, as we could still see one, or two, more moves down or sidewaysAnmerkung
Anmerkung
These Daily indecision Doji are not inspiring any confidence in the bullish narrative for LTC right now. And We have a bear signal on the Godmode; note what has happened every time the lines touch when the blue line descends.Looking towards the 72-49 range...
Anmerkung
My overall count for the Correction:LTC suffers from fugly diagonals and truncated waves, being so closely tied with the price action of BTC. Below is the count for Minor Wave 4, having completed its ABC
A Wave is a diagonal with a truncated 5th Wave (same as is C Wave)
It is funky but the waves measure out to hold to wave length rules
Anmerkung
Going down...Anmerkung
This should also give you a good idea of what BTC is doing right now...Anmerkung
In my opinion LTC is telling us what BTC is going to be doing soon...I am still looking for LTC sub $70
Anmerkung
Here we go...Anmerkung
On its way to $49....Anmerkung
Potential leg up tot he 2.618 at $72...Anmerkung
$49...Anmerkung
Missed it by $0.012...Anmerkung
Current target $64-$66...

Haftungsausschluss
Die Informationen und Veröffentlichungen sind nicht als Finanz-, Anlage-, Handels- oder andere Arten von Ratschlägen oder Empfehlungen gedacht, die von TradingView bereitgestellt oder gebilligt werden, und stellen diese nicht dar. Lesen Sie mehr in den Nutzungsbedingungen.
Haftungsausschluss
Die Informationen und Veröffentlichungen sind nicht als Finanz-, Anlage-, Handels- oder andere Arten von Ratschlägen oder Empfehlungen gedacht, die von TradingView bereitgestellt oder gebilligt werden, und stellen diese nicht dar. Lesen Sie mehr in den Nutzungsbedingungen.