
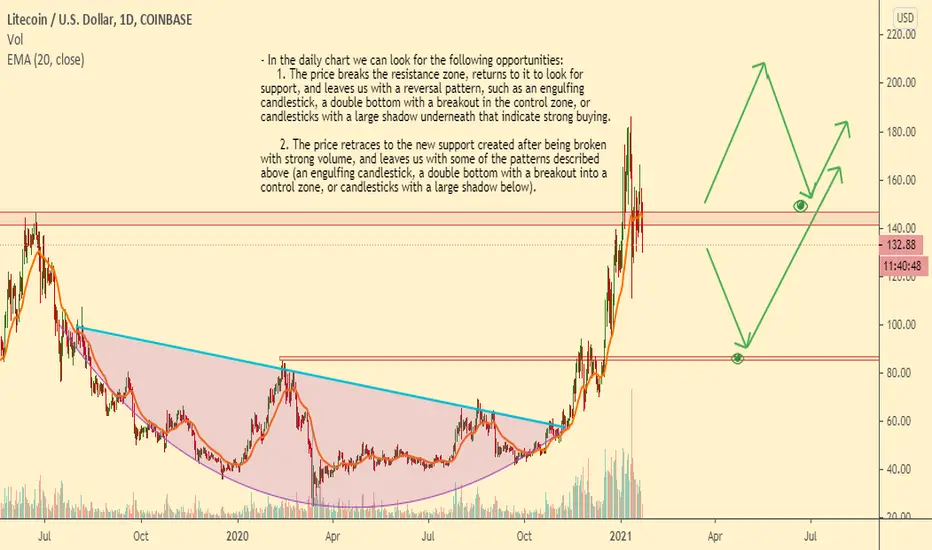
- In the daily chart we can look for the following opportunities:
1. The price breaks the resistance zone, returns to it to look for support, and leaves us with a reversal pattern, such as an engulfing candlestick, a double bottom with a breakout in the control zone, or candlesticks with a large shadow underneath that indicate strong buying.
2. The price retraces to the new support created after being broken with strong volume, and leaves us with some of the patterns described above (an engulfing candlestick, a double bottom with a breakout into a control zone, or candlesticks with a large shadow below).
1. The price breaks the resistance zone, returns to it to look for support, and leaves us with a reversal pattern, such as an engulfing candlestick, a double bottom with a breakout in the control zone, or candlesticks with a large shadow underneath that indicate strong buying.
2. The price retraces to the new support created after being broken with strong volume, and leaves us with some of the patterns described above (an engulfing candlestick, a double bottom with a breakout into a control zone, or candlesticks with a large shadow below).

Haftungsausschluss
Die Informationen und Veröffentlichungen sind nicht als Finanz-, Anlage-, Handels- oder andere Arten von Ratschlägen oder Empfehlungen gedacht, die von TradingView bereitgestellt oder gebilligt werden, und stellen diese nicht dar. Lesen Sie mehr in den Nutzungsbedingungen.
Haftungsausschluss
Die Informationen und Veröffentlichungen sind nicht als Finanz-, Anlage-, Handels- oder andere Arten von Ratschlägen oder Empfehlungen gedacht, die von TradingView bereitgestellt oder gebilligt werden, und stellen diese nicht dar. Lesen Sie mehr in den Nutzungsbedingungen.