
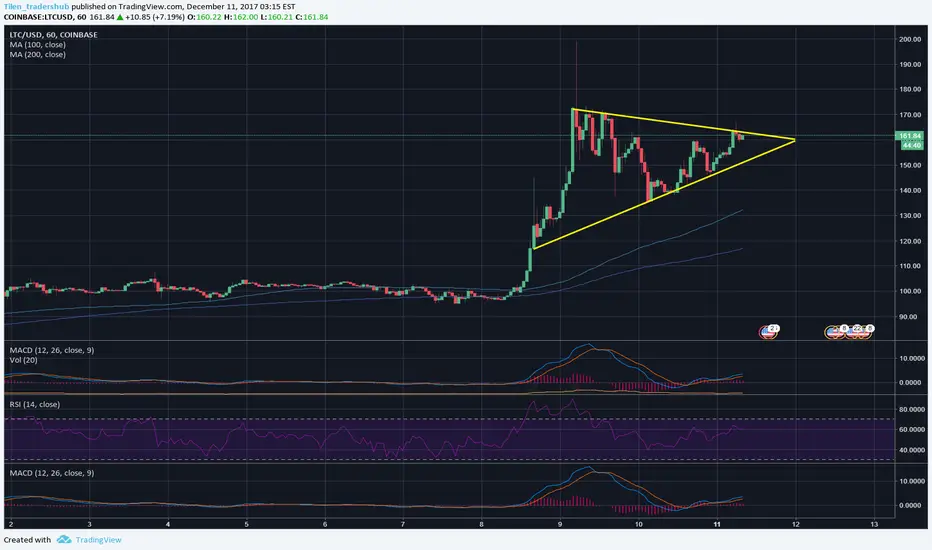
A symmetrical triangle is a chart formation where the slope of the price’s highs and the slope of the price’s lows converge together to a point where it looks like a triangle. During this formation the market is making lower highs and higher lows, neither the buyers nor the sellers are pushing the price far enough to make a clear trend. LTC is forming a bullish pattern and might clear the upper resistance and continue to grind higher. If we get a clean break, LTC could reach $200 very soon. SL should be placed just under the support. RSI & MACD both in bullish mode, which is strong sign that buyers are in control.

Haftungsausschluss
Die Informationen und Veröffentlichungen sind nicht als Finanz-, Anlage-, Handels- oder andere Arten von Ratschlägen oder Empfehlungen gedacht, die von TradingView bereitgestellt oder gebilligt werden, und stellen diese nicht dar. Lesen Sie mehr in den Nutzungsbedingungen.
Haftungsausschluss
Die Informationen und Veröffentlichungen sind nicht als Finanz-, Anlage-, Handels- oder andere Arten von Ratschlägen oder Empfehlungen gedacht, die von TradingView bereitgestellt oder gebilligt werden, und stellen diese nicht dar. Lesen Sie mehr in den Nutzungsbedingungen.