
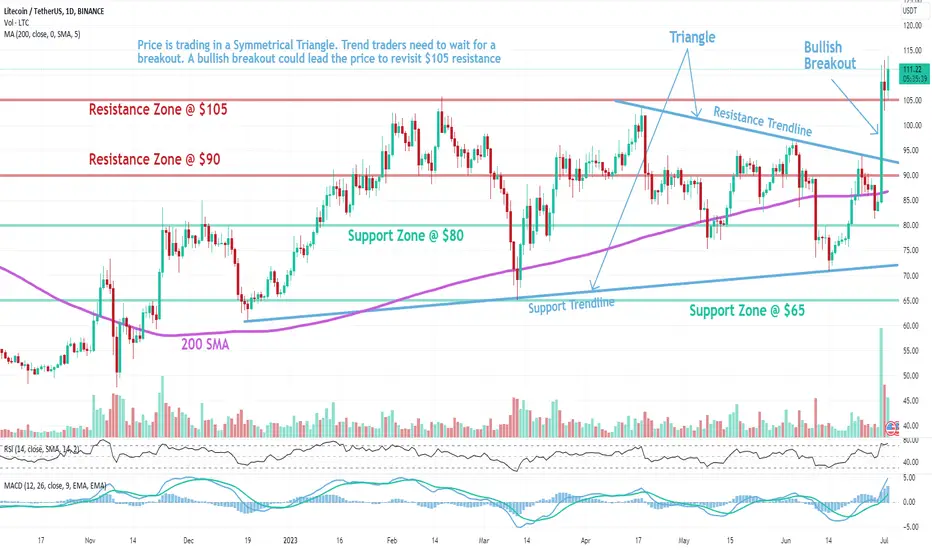
Litecoin (LTC) technical analysis:
Trade setup: Price is trading in a Symmetrical Triangle. Trend traders need to wait for a breakout. A bullish breakout could lead the price to revisit $105 resistance
Pattern: Symmetrical Triangle, which is a neutral pattern, suggesting indecision in the market. Although it could break either up or down, it usually breaks in the direction of the prevailing trend (i.e. continuation not reversal).
Trend: Uptrend on Short-Term basis, Neutral on Medium-Term basis and Downtrend on Long-Term basis.
Momentum is Bullish (MACD Line is above MACD Signal Line and RSI is above 55).
Support and Resistance: Nearest Support Zone is $80, then $65. The nearest Resistance Zone is $90, which it broke then $105.

Haftungsausschluss
Die Informationen und Veröffentlichungen sind nicht als Finanz-, Anlage-, Handels- oder andere Arten von Ratschlägen oder Empfehlungen gedacht, die von TradingView bereitgestellt oder gebilligt werden, und stellen diese nicht dar. Lesen Sie mehr in den Nutzungsbedingungen.
Haftungsausschluss
Die Informationen und Veröffentlichungen sind nicht als Finanz-, Anlage-, Handels- oder andere Arten von Ratschlägen oder Empfehlungen gedacht, die von TradingView bereitgestellt oder gebilligt werden, und stellen diese nicht dar. Lesen Sie mehr in den Nutzungsbedingungen.