
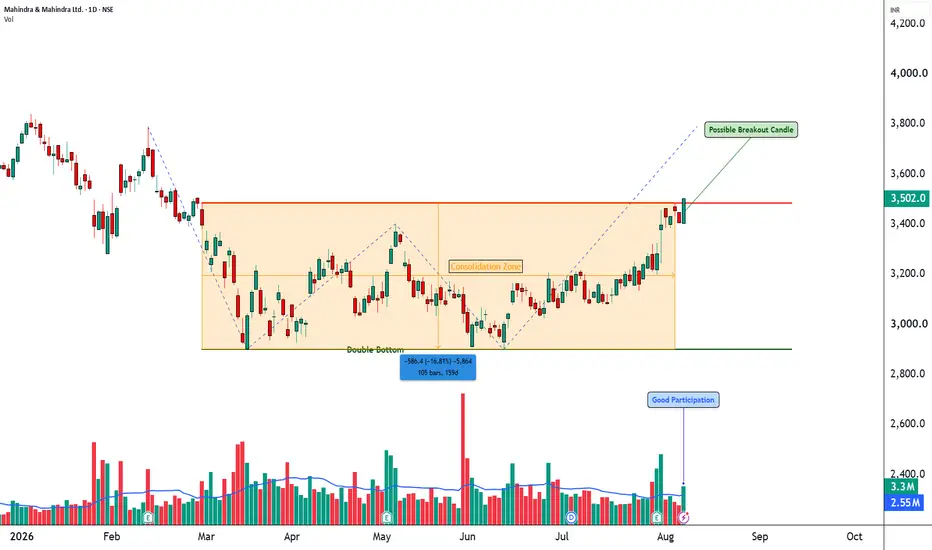
📊 Mahindra & Mahindra: Daily Technical Snapshot – Strong Bullish Expansion
📊 STWP Technical Analysis
________________________________________
MARKET STRUCTURE SNAPSHOT | NSE: M&M | DAILY
Closing Price: 3,502.00 (+96.00 | +2.82%)
Core Trend: Uptrend
Market State: Bullish Expansion / Breakout Phase
Price Structure: Strong bullish price expansion following a period of consolidation, with price now approaching the next resistance cluster.
________________________________________
OPERATIONAL PRICE GRID & KEY REFERENCE LEVELS
Model Reference Level: 3,504.90
Hard Invalidation Level: 3,057.70
Structural Risk: 447.20 (12.76%)
Resistance Levels: R1 3,537.23 | R2 3,577.47 | R3 3,640.03
Support Levels: S1 3,434.43 | S2 3,366.87 | S3 3,331.63
Range Structure: Recent consolidation followed by bullish expansion
Higher Timeframe Observation Zone: 3,640+
________________________________________
MOMENTUM, PARTICIPATION & CPR DATA
Volume: 3.30 Million Shares
20-Day Average Volume: 2.55 Million Shares
Volume Ratio: ~1.29x average
Volume Character: Above-Average Participation
Current Bias: BULLISH — WATCH FOR PULLBACKS
CPR State: Bullish Zone | CPR Moving Down (Bearish) | Wide
Today's CPR: Pivot 3,420.30 | Top 3,413.20 | Base 3,427.50
Tomorrow's CPR: Pivot 3,485.30 | Top 3,497.30 | Base 3,473.30
________________________________________
💡 STWP QUICK READ
Strong bullish expansion above the recent consolidation zone.
Volume at 3.30M vs 2.55M average, showing increased participation.
RSI at 68.73 confirms strong momentum but is approaching an extended zone.
ADX at 33.51 indicates a developing strong trend.
Immediate observation remains around 3,537–3,640.
________________________________________
📚 EDUCATIONAL OBSERVATION
Mahindra & Mahindra is showing a strong bullish expansion on the daily chart, with price advancing to 3,502 after emerging from a period of consolidation. The latest candle reflects strong buying interest and has pushed the stock closer to the next resistance cluster.
Momentum remains strong. RSI at 68.73 indicates that buyers remain firmly active, while ADX at 33.51 points to a stronger developing trend. ROC of +10.77% confirms positive price acceleration, and CCI at +136.43 supports the bullish momentum structure. However, the Stochastic reading of 99.22 highlights an extremely extended short-term momentum condition, meaning traders should remain alert to consolidation or profit-taking.
Volume stands at 3.30 million shares compared with a 20-day average of 2.55 million, giving a participation ratio of approximately 1.29x. The expansion in volume provides additional confirmation that the current price move is attracting above-normal participation.
The immediate resistance cluster is positioned at 3,537.23, 3,577.47 and 3,640.03. On the downside, 3,434.43 becomes the first important observation support, followed by 3,366.87 and 3,331.63.
The projected CPR has shifted higher, with tomorrow's Pivot at 3,485.30 and a projected range between 3,473.30 and 3,497.30. A higher CPR structure can indicate improving price acceptance, although the bearish CPR movement shown on the dashboard warrants monitoring.
________________________________________
🏢 BUSINESS & FUNDAMENTAL UPDATE | Q1 FY27
Mahindra & Mahindra delivered a strong Q1 FY27, with consolidated revenue rising 28% YoY to 58,188 crore and consolidated PAT increasing 34% to 5,455 crore. Auto volumes rose 23%, while SUV revenue market share reached 25% and tractor market share improved to 44.9%. The Auto and Farm businesses continued to strengthen their positions, while Services also showed strong growth, including a 13% increase in Mahindra Finance AUM and continued margin improvement at Tech Mahindra. Overall, the results point to broad-based operating strength across the group. (Mahindra)
STWP Fundamental Takeaway: Strong earnings growth combined with improving operating performance provides a constructive fundamental backdrop, while the chart is simultaneously showing strong price-volume expansion. The technical and fundamental signals should, however, be evaluated independently.
________________________________________
📖 EDUCATIONAL NOTE
The current setup demonstrates an important STWP principle: a strong price move becomes more meaningful when supported by participation, momentum and improving business performance.
At the same time, an extended momentum reading does not automatically mean that price must reverse. It simply highlights the possibility of increased volatility and the importance of observing how price behaves around key levels. Support and resistance levels should be treated as observation zones rather than predictive targets. Technical indicators, volume, CPR and fundamental results are educational tools for understanding market structure and should be used within a disciplined risk-management framework.
________________________________________
⚠️ DISCLAIMER
This analysis is strictly for educational and informational purposes. It is not financial, investment or trading advice, and should not be considered a recommendation to buy or sell any security. Market investments are subject to risk, including possible loss of capital. Past performance, technical patterns and financial results do not guarantee future performance. Please conduct your own research and consult a SEBI-registered investment adviser before making investment decisions.
📊 STWP Technical Analysis
________________________________________
MARKET STRUCTURE SNAPSHOT | NSE: M&M | DAILY
Closing Price: 3,502.00 (+96.00 | +2.82%)
Core Trend: Uptrend
Market State: Bullish Expansion / Breakout Phase
Price Structure: Strong bullish price expansion following a period of consolidation, with price now approaching the next resistance cluster.
________________________________________
OPERATIONAL PRICE GRID & KEY REFERENCE LEVELS
Model Reference Level: 3,504.90
Hard Invalidation Level: 3,057.70
Structural Risk: 447.20 (12.76%)
Resistance Levels: R1 3,537.23 | R2 3,577.47 | R3 3,640.03
Support Levels: S1 3,434.43 | S2 3,366.87 | S3 3,331.63
Range Structure: Recent consolidation followed by bullish expansion
Higher Timeframe Observation Zone: 3,640+
________________________________________
MOMENTUM, PARTICIPATION & CPR DATA
Volume: 3.30 Million Shares
20-Day Average Volume: 2.55 Million Shares
Volume Ratio: ~1.29x average
Volume Character: Above-Average Participation
Current Bias: BULLISH — WATCH FOR PULLBACKS
CPR State: Bullish Zone | CPR Moving Down (Bearish) | Wide
Today's CPR: Pivot 3,420.30 | Top 3,413.20 | Base 3,427.50
Tomorrow's CPR: Pivot 3,485.30 | Top 3,497.30 | Base 3,473.30
________________________________________
💡 STWP QUICK READ
Strong bullish expansion above the recent consolidation zone.
Volume at 3.30M vs 2.55M average, showing increased participation.
RSI at 68.73 confirms strong momentum but is approaching an extended zone.
ADX at 33.51 indicates a developing strong trend.
Immediate observation remains around 3,537–3,640.
________________________________________
📚 EDUCATIONAL OBSERVATION
Mahindra & Mahindra is showing a strong bullish expansion on the daily chart, with price advancing to 3,502 after emerging from a period of consolidation. The latest candle reflects strong buying interest and has pushed the stock closer to the next resistance cluster.
Momentum remains strong. RSI at 68.73 indicates that buyers remain firmly active, while ADX at 33.51 points to a stronger developing trend. ROC of +10.77% confirms positive price acceleration, and CCI at +136.43 supports the bullish momentum structure. However, the Stochastic reading of 99.22 highlights an extremely extended short-term momentum condition, meaning traders should remain alert to consolidation or profit-taking.
Volume stands at 3.30 million shares compared with a 20-day average of 2.55 million, giving a participation ratio of approximately 1.29x. The expansion in volume provides additional confirmation that the current price move is attracting above-normal participation.
The immediate resistance cluster is positioned at 3,537.23, 3,577.47 and 3,640.03. On the downside, 3,434.43 becomes the first important observation support, followed by 3,366.87 and 3,331.63.
The projected CPR has shifted higher, with tomorrow's Pivot at 3,485.30 and a projected range between 3,473.30 and 3,497.30. A higher CPR structure can indicate improving price acceptance, although the bearish CPR movement shown on the dashboard warrants monitoring.
________________________________________
🏢 BUSINESS & FUNDAMENTAL UPDATE | Q1 FY27
Mahindra & Mahindra delivered a strong Q1 FY27, with consolidated revenue rising 28% YoY to 58,188 crore and consolidated PAT increasing 34% to 5,455 crore. Auto volumes rose 23%, while SUV revenue market share reached 25% and tractor market share improved to 44.9%. The Auto and Farm businesses continued to strengthen their positions, while Services also showed strong growth, including a 13% increase in Mahindra Finance AUM and continued margin improvement at Tech Mahindra. Overall, the results point to broad-based operating strength across the group. (Mahindra)
STWP Fundamental Takeaway: Strong earnings growth combined with improving operating performance provides a constructive fundamental backdrop, while the chart is simultaneously showing strong price-volume expansion. The technical and fundamental signals should, however, be evaluated independently.
________________________________________
📖 EDUCATIONAL NOTE
The current setup demonstrates an important STWP principle: a strong price move becomes more meaningful when supported by participation, momentum and improving business performance.
At the same time, an extended momentum reading does not automatically mean that price must reverse. It simply highlights the possibility of increased volatility and the importance of observing how price behaves around key levels. Support and resistance levels should be treated as observation zones rather than predictive targets. Technical indicators, volume, CPR and fundamental results are educational tools for understanding market structure and should be used within a disciplined risk-management framework.
________________________________________
⚠️ DISCLAIMER
This analysis is strictly for educational and informational purposes. It is not financial, investment or trading advice, and should not be considered a recommendation to buy or sell any security. Market investments are subject to risk, including possible loss of capital. Past performance, technical patterns and financial results do not guarantee future performance. Please conduct your own research and consult a SEBI-registered investment adviser before making investment decisions.

STWP | Mentor & Demand-Supply Specialist |
Empowering traders through structured learning |
simpletradewithpatience.com
Community: chat.whatsapp.com/BEYz0tkqP0fJPBCWf59uel
wa.me/message/6IOPHGOXMGZ4N1
Educational Only
Empowering traders through structured learning |
simpletradewithpatience.com
Community: chat.whatsapp.com/BEYz0tkqP0fJPBCWf59uel
wa.me/message/6IOPHGOXMGZ4N1
Educational Only
Haftungsausschluss
Die Informationen und Veröffentlichungen sind nicht als Finanz-, Anlage-, Handels- oder andere Arten von Ratschlägen oder Empfehlungen gedacht, die von TradingView bereitgestellt oder gebilligt werden, und stellen diese nicht dar. Lesen Sie mehr in den Nutzungsbedingungen.
STWP | Mentor & Demand-Supply Specialist |
Empowering traders through structured learning |
simpletradewithpatience.com
Community: chat.whatsapp.com/BEYz0tkqP0fJPBCWf59uel
wa.me/message/6IOPHGOXMGZ4N1
Educational Only
Empowering traders through structured learning |
simpletradewithpatience.com
Community: chat.whatsapp.com/BEYz0tkqP0fJPBCWf59uel
wa.me/message/6IOPHGOXMGZ4N1
Educational Only
Haftungsausschluss
Die Informationen und Veröffentlichungen sind nicht als Finanz-, Anlage-, Handels- oder andere Arten von Ratschlägen oder Empfehlungen gedacht, die von TradingView bereitgestellt oder gebilligt werden, und stellen diese nicht dar. Lesen Sie mehr in den Nutzungsbedingungen.