Long
Polygon Goes Bullish, Solana Will Follow...
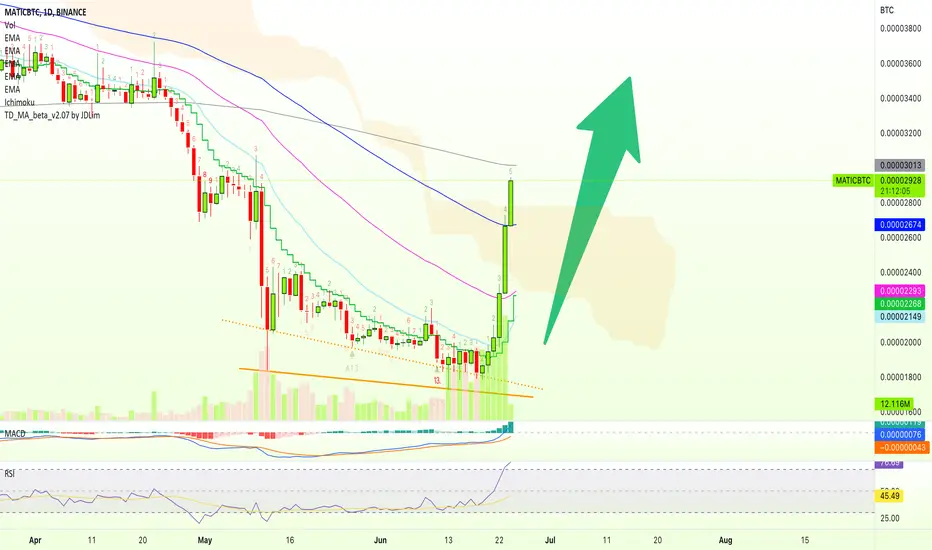
Look at this chart, the MATICBTC (Polygon) chart is identical to the SOLUSDT (Solana) chart.
The only difference is that Polygon (MATICBTC) is more advanced.
We see it trading above EMA50 while SOLUSDT is still below it... See it here!
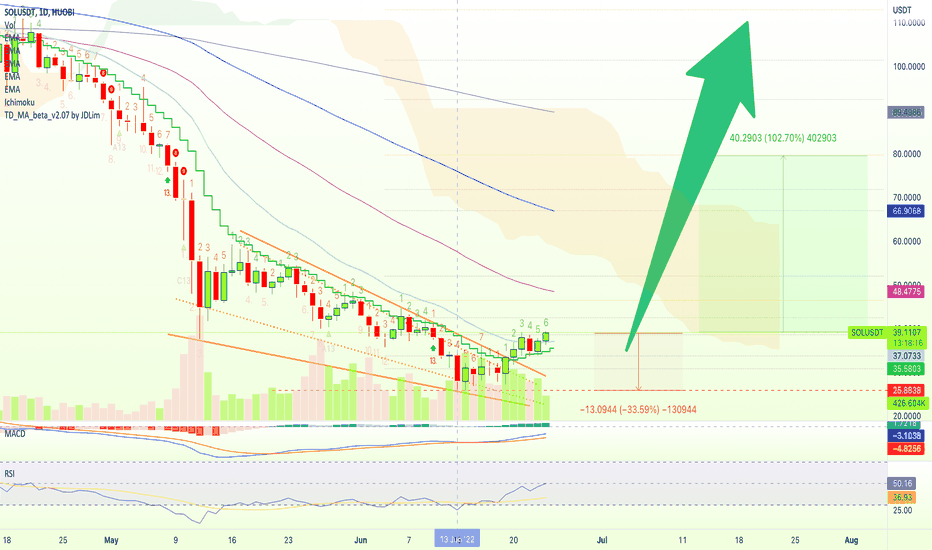
We know what follows for Solana (UP!).
The same for Polygon; Time to grow!
Namaste.
The only difference is that Polygon (MATICBTC) is more advanced.
We see it trading above EMA50 while SOLUSDT is still below it... See it here!
We know what follows for Solana (UP!).
The same for Polygon; Time to grow!
Namaste.

Trading Cryptocurrencies can be the hardest undertaking ever without the right trade-numbers, without accurate private-access information. Free is free, but the best always requires sweat, an investment. Since 2017 👇
t.me/masteranandatrades/8778
t.me/masteranandatrades/8778
Verbundene Veröffentlichungen
Haftungsausschluss
Die Informationen und Veröffentlichungen sind nicht als Finanz-, Anlage-, Handels- oder andere Arten von Ratschlägen oder Empfehlungen gedacht, die von TradingView bereitgestellt oder gebilligt werden, und stellen diese nicht dar. Lesen Sie mehr in den Nutzungsbedingungen.
Trading Cryptocurrencies can be the hardest undertaking ever without the right trade-numbers, without accurate private-access information. Free is free, but the best always requires sweat, an investment. Since 2017 👇
t.me/masteranandatrades/8778
t.me/masteranandatrades/8778
Verbundene Veröffentlichungen
Haftungsausschluss
Die Informationen und Veröffentlichungen sind nicht als Finanz-, Anlage-, Handels- oder andere Arten von Ratschlägen oder Empfehlungen gedacht, die von TradingView bereitgestellt oder gebilligt werden, und stellen diese nicht dar. Lesen Sie mehr in den Nutzungsbedingungen.