MATIC 1D Interval Review
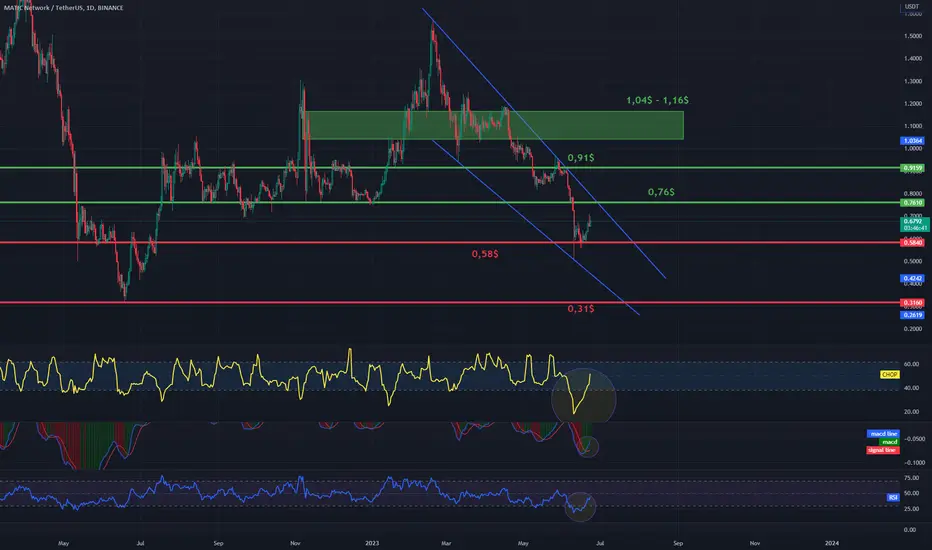
The last one in today's chart is the MATIC chart in pair to USDT, on a one-day interval. First, we will use the blue lines to mark the downtrend channel where the price is moving in the upper range.
Moving on, we can move on to marking support areas when the price returns to a correction. And here the first very strong support that has kept the price so far is at $ 0.58, but if we fall lower, the next support is at $ 0.31.
Looking the other way, we see that the price has to face the $0.76 resistance, only when it breaks it will move towards the $0.91 resistance and then towards the very strong $1.04 to $1,16 resistance zone.
Please look at the CHOP index, which indicates that we have more and more energy, the MACD indicates a downtrend, while the RSI shows that a small price increase gives a strong movement on the indicator, which can quickly limit the room for further increases, in the coming hours we can see further growth.
Moving on, we can move on to marking support areas when the price returns to a correction. And here the first very strong support that has kept the price so far is at $ 0.58, but if we fall lower, the next support is at $ 0.31.
Looking the other way, we see that the price has to face the $0.76 resistance, only when it breaks it will move towards the $0.91 resistance and then towards the very strong $1.04 to $1,16 resistance zone.
Please look at the CHOP index, which indicates that we have more and more energy, the MACD indicates a downtrend, while the RSI shows that a small price increase gives a strong movement on the indicator, which can quickly limit the room for further increases, in the coming hours we can see further growth.

Haftungsausschluss
Die Informationen und Veröffentlichungen sind nicht als Finanz-, Anlage-, Handels- oder andere Arten von Ratschlägen oder Empfehlungen gedacht, die von TradingView bereitgestellt oder gebilligt werden, und stellen diese nicht dar. Lesen Sie mehr in den Nutzungsbedingungen.
Haftungsausschluss
Die Informationen und Veröffentlichungen sind nicht als Finanz-, Anlage-, Handels- oder andere Arten von Ratschlägen oder Empfehlungen gedacht, die von TradingView bereitgestellt oder gebilligt werden, und stellen diese nicht dar. Lesen Sie mehr in den Nutzungsbedingungen.