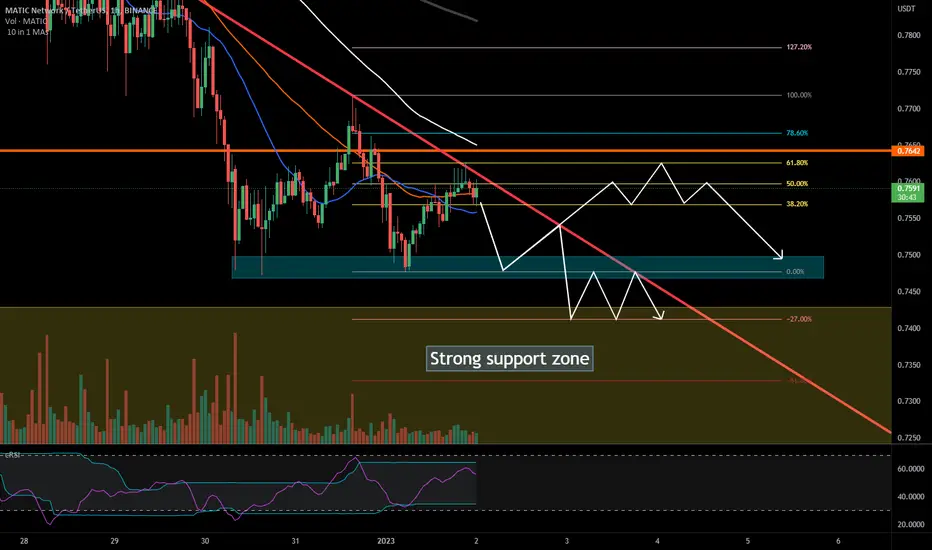
2 possible MATIC trajectories
$BINANCE:MATICUSDT
The price is near a very strong support zone . If the price bounces once again against the red trendline as shown on the chart, it is most likely to fall to the support zone drawn approximately to the -27% Fibonacci level. If the trendline is not respected and a strong bullish candle closes above the red trendline, it is most likely that the price will rise to the 61.8% Fibonacci level, coinciding approximately with a previous high.
The price is near a very strong support zone . If the price bounces once again against the red trendline as shown on the chart, it is most likely to fall to the support zone drawn approximately to the -27% Fibonacci level. If the trendline is not respected and a strong bullish candle closes above the red trendline, it is most likely that the price will rise to the 61.8% Fibonacci level, coinciding approximately with a previous high.

Haftungsausschluss
Die Informationen und Veröffentlichungen sind nicht als Finanz-, Anlage-, Handels- oder andere Arten von Ratschlägen oder Empfehlungen gedacht, die von TradingView bereitgestellt oder gebilligt werden, und stellen diese nicht dar. Lesen Sie mehr in den Nutzungsbedingungen.
Haftungsausschluss
Die Informationen und Veröffentlichungen sind nicht als Finanz-, Anlage-, Handels- oder andere Arten von Ratschlägen oder Empfehlungen gedacht, die von TradingView bereitgestellt oder gebilligt werden, und stellen diese nicht dar. Lesen Sie mehr in den Nutzungsbedingungen.