Long
BBMA : MATIC still BULLISH.
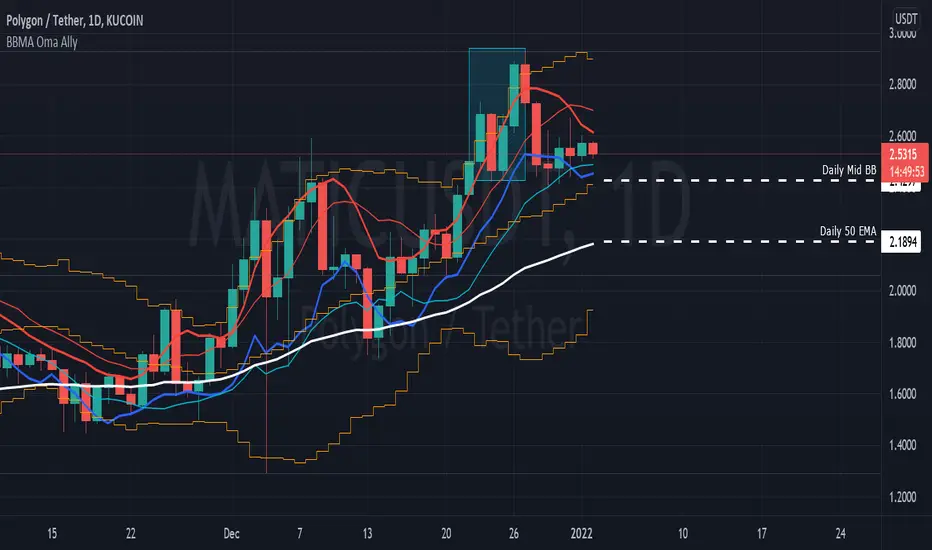
Here is my follow up on the Bearish MATIC analysis.
On this Daily Chart, there is momentum candlestick that break above the Daily Upper Band. The key is there is no Extreme Momentum shown during the break. (Which is the 5/10 High [RED] MA break the Upper Band. This tell us that the Bullish Momentum is still VALID.
You can Buy using Cost Averaging at MID BB and if the price goes down, Buy more around the 50 EMA Zone.
On this Daily Chart, there is momentum candlestick that break above the Daily Upper Band. The key is there is no Extreme Momentum shown during the break. (Which is the 5/10 High [RED] MA break the Upper Band. This tell us that the Bullish Momentum is still VALID.
You can Buy using Cost Averaging at MID BB and if the price goes down, Buy more around the 50 EMA Zone.

Verbundene Veröffentlichungen
Haftungsausschluss
Die Informationen und Veröffentlichungen sind nicht als Finanz-, Anlage-, Handels- oder andere Arten von Ratschlägen oder Empfehlungen gedacht, die von TradingView bereitgestellt oder gebilligt werden, und stellen diese nicht dar. Lesen Sie mehr in den Nutzungsbedingungen.
Verbundene Veröffentlichungen
Haftungsausschluss
Die Informationen und Veröffentlichungen sind nicht als Finanz-, Anlage-, Handels- oder andere Arten von Ratschlägen oder Empfehlungen gedacht, die von TradingView bereitgestellt oder gebilligt werden, und stellen diese nicht dar. Lesen Sie mehr in den Nutzungsbedingungen.