
Trend Structure (N Wave)
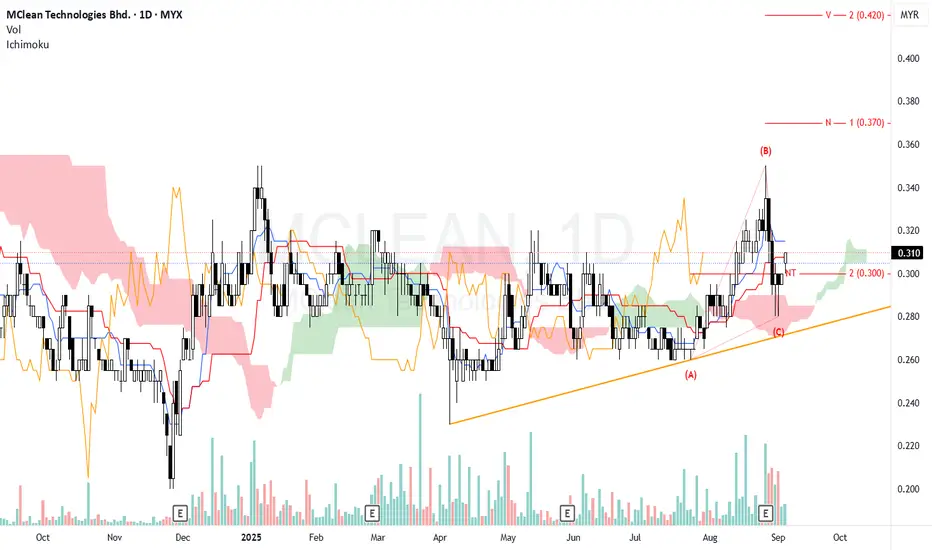
Price formed an ABC correction (A–B–C) and rebounded from point (C), aligning with the uptrend support line.
The immediate resistance is around 0.320 (Tenkan & Kijun levels).
Ichimoku
Price at 0.310 is sitting just above the NT support (0.300).
Kumo: Price is retesting the top of the thin Kumo area. A close above 0.310–0.315 would strengthen the bullish stance.
Chikou Span: Hovering near candles, needs a clearer breakout to confirm trend continuation.
Bullish Case
If price holds above 0.300 (NT) and breaks 0.315–0.320, momentum could push towards 0.370 (N projection).
Further upside to 0.420 (V projection) if volume expands and Kumo breakout sustains.
Price is showing signs of resuming its uptrend after a corrective ABC wave. The NT level at 0.300 is a key pivot: holding above it maintains the bullish outlook, with 0.370 (N) as the first projection target and 0.420 (V) as an extended target. However, a breakdown below NT and the uptrendline could weaken the bullish scenario.
Bearish Risk
A breakdown below 0.300 (NT) may invalidate the bullish N-wave, with possible retest at the trendline near 0.285–0.290.
Losing that trendline could shift bias to bearish.
Entry Zone: Around 0.305–0.315 (if support holds).
Stop Loss: Below 0.295 (to protect against false breakout).
Targets:
TP1: 0.370 (N)
TP2: 0.420 (V)
Price formed an ABC correction (A–B–C) and rebounded from point (C), aligning with the uptrend support line.
The immediate resistance is around 0.320 (Tenkan & Kijun levels).
Ichimoku
Price at 0.310 is sitting just above the NT support (0.300).
Kumo: Price is retesting the top of the thin Kumo area. A close above 0.310–0.315 would strengthen the bullish stance.
Chikou Span: Hovering near candles, needs a clearer breakout to confirm trend continuation.
Bullish Case
If price holds above 0.300 (NT) and breaks 0.315–0.320, momentum could push towards 0.370 (N projection).
Further upside to 0.420 (V projection) if volume expands and Kumo breakout sustains.
Price is showing signs of resuming its uptrend after a corrective ABC wave. The NT level at 0.300 is a key pivot: holding above it maintains the bullish outlook, with 0.370 (N) as the first projection target and 0.420 (V) as an extended target. However, a breakdown below NT and the uptrendline could weaken the bullish scenario.
Bearish Risk
A breakdown below 0.300 (NT) may invalidate the bullish N-wave, with possible retest at the trendline near 0.285–0.290.
Losing that trendline could shift bias to bearish.
Entry Zone: Around 0.305–0.315 (if support holds).
Stop Loss: Below 0.295 (to protect against false breakout).
Targets:
TP1: 0.370 (N)
TP2: 0.420 (V)
Trade geschlossen: Ziel wurde erreicht
Reach target
Haftungsausschluss
Die Informationen und Veröffentlichungen sind nicht als Finanz-, Anlage-, Handels- oder andere Arten von Ratschlägen oder Empfehlungen gedacht, die von TradingView bereitgestellt oder gebilligt werden, und stellen diese nicht dar. Lesen Sie mehr in den Nutzungsbedingungen.
Haftungsausschluss
Die Informationen und Veröffentlichungen sind nicht als Finanz-, Anlage-, Handels- oder andere Arten von Ratschlägen oder Empfehlungen gedacht, die von TradingView bereitgestellt oder gebilligt werden, und stellen diese nicht dar. Lesen Sie mehr in den Nutzungsbedingungen.