
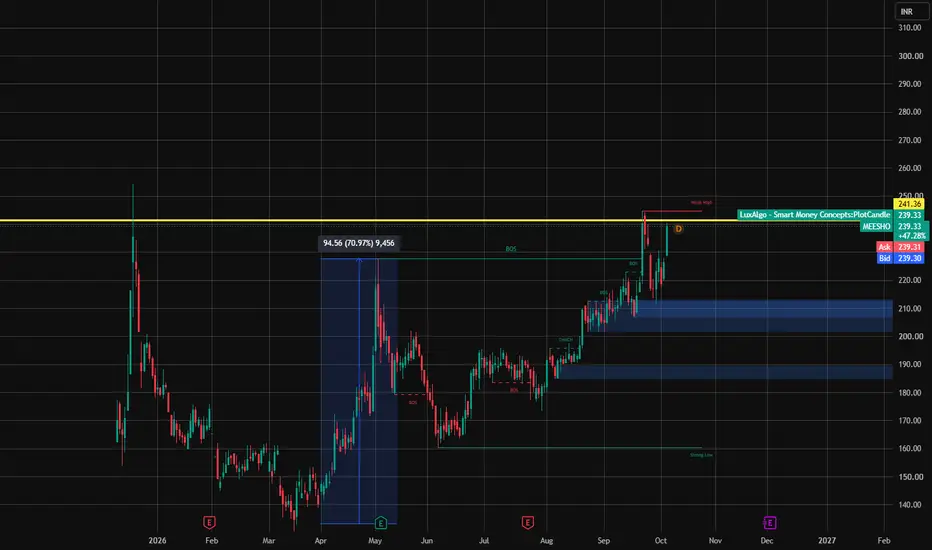
I went through Meesho's ratios and financials. One thing first: if you look only at headline numbers, the picture will be incomplete.
What looks good ✅
→ FY26 net sales of ₹12,626 cr, up 34.5%
→ Almost no debt, with interest of only ~₹9 cr
→ Current ratio of 1.55, and cash up from ₹147 cr to ₹620 cr
→ Asset-light model: asset turnover of ~1.7 and near-zero receivables
What needs a closer look ⚠️
→ FY26 expenses grew 41.6% against 34.5% sales growth, so costs outpaced revenue
→ PBIDT went from -₹68 cr in FY25 to -₹1,012 cr in FY26
→ Excluding other income (₹473 cr), the core operating loss is roughly 11.8% of sales (my calculation)
→ Operating cash flow in FY26 was -₹3,875 cr, while financing brought in ₹4,101 cr
→ ROE of -59% and ROCE of -41%
A trap to avoid 🪤
FY25's net loss margin was -41.84% and FY26's is -10.6%. That sounds like a big profitability improvement. But a large part of the FY25 loss came from tax (₹2,487 cr) and exceptional items (₹1,346 cr). The real operating picture is different, so understand PBIDT and the role of other income before leaning on net profit.
The valuation question 💭
Market cap is ~₹1.09 lakh cr, about 8.7x FY26 sales. P/E doesn't apply because the company is loss-making. The market is already pricing in long-term growth and future profitability. Here's a simple illustration (my assumptions, not a forecast): at an 8% net margin and 25x P/E, justifying this value would need roughly ₹55,000 cr of revenue, about 4x the TTM figure.
What I'd track next 🔍
Whether quarterly PBIDT is moving toward break-even
Whether operating cash flow normalises
The source of other income
How do you see Meesho: a real growth story, or too early to tell? Tell me in the comments 👇
Disclaimer: I am an NISM-certified Research Analyst. This post is for educational purposes only and is not investment advice. Data is taken from screenshots dated 6 Oct 2026. Please do your own research or consult a registered advisor before investing.
What looks good ✅
→ FY26 net sales of ₹12,626 cr, up 34.5%
→ Almost no debt, with interest of only ~₹9 cr
→ Current ratio of 1.55, and cash up from ₹147 cr to ₹620 cr
→ Asset-light model: asset turnover of ~1.7 and near-zero receivables
What needs a closer look ⚠️
→ FY26 expenses grew 41.6% against 34.5% sales growth, so costs outpaced revenue
→ PBIDT went from -₹68 cr in FY25 to -₹1,012 cr in FY26
→ Excluding other income (₹473 cr), the core operating loss is roughly 11.8% of sales (my calculation)
→ Operating cash flow in FY26 was -₹3,875 cr, while financing brought in ₹4,101 cr
→ ROE of -59% and ROCE of -41%
A trap to avoid 🪤
FY25's net loss margin was -41.84% and FY26's is -10.6%. That sounds like a big profitability improvement. But a large part of the FY25 loss came from tax (₹2,487 cr) and exceptional items (₹1,346 cr). The real operating picture is different, so understand PBIDT and the role of other income before leaning on net profit.
The valuation question 💭
Market cap is ~₹1.09 lakh cr, about 8.7x FY26 sales. P/E doesn't apply because the company is loss-making. The market is already pricing in long-term growth and future profitability. Here's a simple illustration (my assumptions, not a forecast): at an 8% net margin and 25x P/E, justifying this value would need roughly ₹55,000 cr of revenue, about 4x the TTM figure.
What I'd track next 🔍
Whether quarterly PBIDT is moving toward break-even
Whether operating cash flow normalises
The source of other income
How do you see Meesho: a real growth story, or too early to tell? Tell me in the comments 👇
Disclaimer: I am an NISM-certified Research Analyst. This post is for educational purposes only and is not investment advice. Data is taken from screenshots dated 6 Oct 2026. Please do your own research or consult a registered advisor before investing.

Haftungsausschluss
Die Informationen und Veröffentlichungen sind nicht als Finanz-, Anlage-, Handels- oder andere Arten von Ratschlägen oder Empfehlungen gedacht, die von TradingView bereitgestellt oder gebilligt werden, und stellen diese nicht dar. Lesen Sie mehr in den Nutzungsbedingungen.
Haftungsausschluss
Die Informationen und Veröffentlichungen sind nicht als Finanz-, Anlage-, Handels- oder andere Arten von Ratschlägen oder Empfehlungen gedacht, die von TradingView bereitgestellt oder gebilligt werden, und stellen diese nicht dar. Lesen Sie mehr in den Nutzungsbedingungen.