
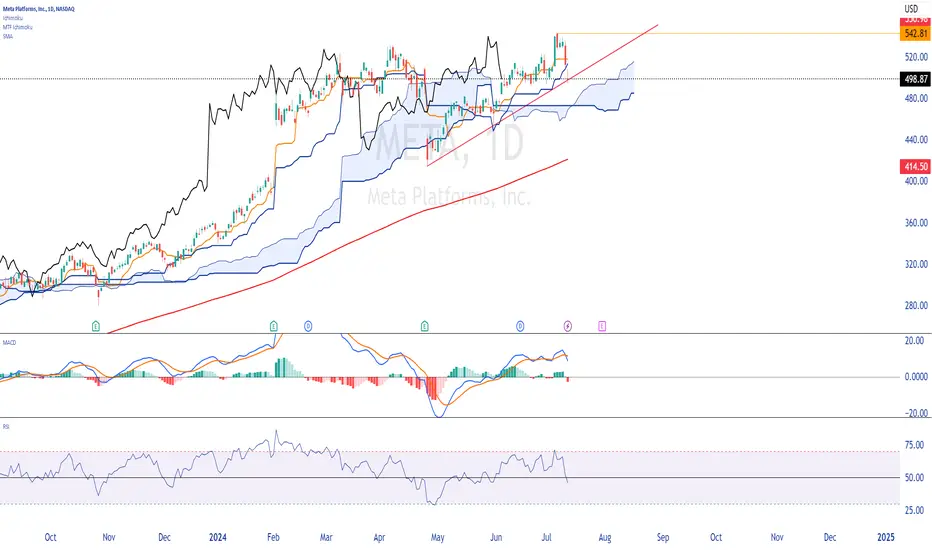
Daily chart with ichimoku.
Price under the tankan and under the kinjun.
We are above the cloud. Be careful, the cloud is thin and prices could pass through it easily.
The SMA 200 is under the cloud, so no worries.
MACD increasing, but above the 0 line.
The RSI is slightly below 50.
To conclude, the trend is bullish, we must monitor the break of my red line, which could announce a corrective movement.
Happy trading to you.
Price under the tankan and under the kinjun.
We are above the cloud. Be careful, the cloud is thin and prices could pass through it easily.
The SMA 200 is under the cloud, so no worries.
MACD increasing, but above the 0 line.
The RSI is slightly below 50.
To conclude, the trend is bullish, we must monitor the break of my red line, which could announce a corrective movement.
Happy trading to you.

Haftungsausschluss
Die Informationen und Veröffentlichungen sind nicht als Finanz-, Anlage-, Handels- oder andere Arten von Ratschlägen oder Empfehlungen gedacht, die von TradingView bereitgestellt oder gebilligt werden, und stellen diese nicht dar. Lesen Sie mehr in den Nutzungsbedingungen.
Haftungsausschluss
Die Informationen und Veröffentlichungen sind nicht als Finanz-, Anlage-, Handels- oder andere Arten von Ratschlägen oder Empfehlungen gedacht, die von TradingView bereitgestellt oder gebilligt werden, und stellen diese nicht dar. Lesen Sie mehr in den Nutzungsbedingungen.