Long
MMAT
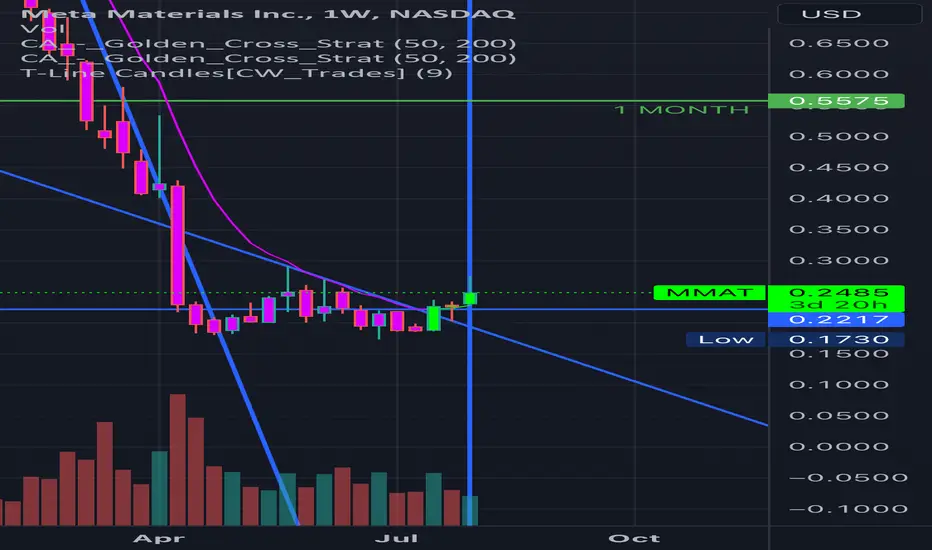
$NASDAQ:MMAT Has Recently crossed on weekly timeframe I’ve been using for trading. Very bullish.
Nearly every time it has crossed it has then run to the monthly (trigger yellow) which gives 1-3 MONTHS OF bullish activity consistently.
It has ran its course down and into accumulation past few weeks and officially broken out on my levels.
A close under 0.22 can invalidate the whole thing IMO.
Running PLENTY of long dated October and jan24 0.50 calls. Looking further possibly.
Looking very very strong here.
Nearly every time it has crossed it has then run to the monthly (trigger yellow) which gives 1-3 MONTHS OF bullish activity consistently.
It has ran its course down and into accumulation past few weeks and officially broken out on my levels.
A close under 0.22 can invalidate the whole thing IMO.
Running PLENTY of long dated October and jan24 0.50 calls. Looking further possibly.
Looking very very strong here.

Haftungsausschluss
Die Informationen und Veröffentlichungen sind nicht als Finanz-, Anlage-, Handels- oder andere Arten von Ratschlägen oder Empfehlungen gedacht, die von TradingView bereitgestellt oder gebilligt werden, und stellen diese nicht dar. Lesen Sie mehr in den Nutzungsbedingungen.
Haftungsausschluss
Die Informationen und Veröffentlichungen sind nicht als Finanz-, Anlage-, Handels- oder andere Arten von Ratschlägen oder Empfehlungen gedacht, die von TradingView bereitgestellt oder gebilligt werden, und stellen diese nicht dar. Lesen Sie mehr in den Nutzungsbedingungen.