
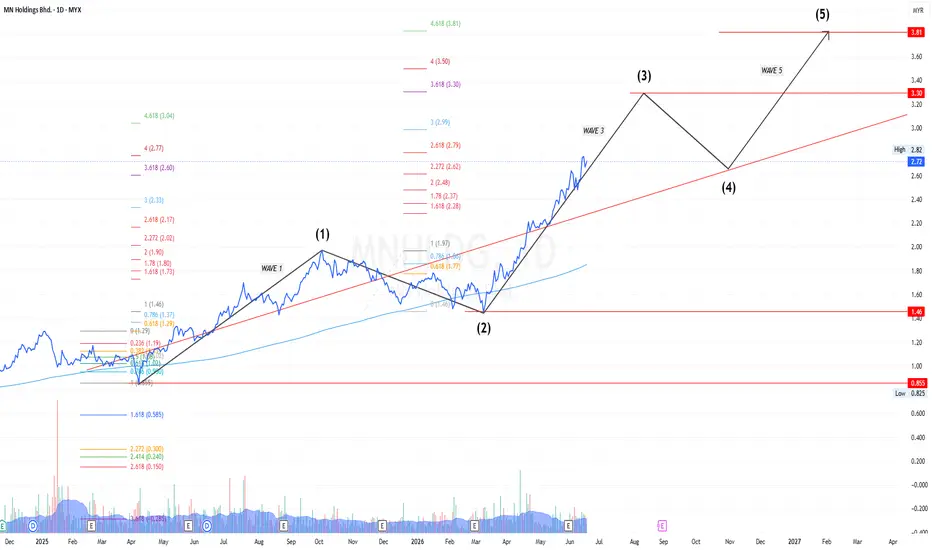
Based on the daily chart of MNHLDG, the price action is carving out a highly Impulse Wave (Motive Wave) structure according to Elliott Wave Theory.
Following the completion of Wave 1 and a healthy Wave 2 correction that held firmly above the critical RM1.46 support, the market is currently accelerating within a powerful Wave 3. Backed by Fibonacci extension levels, this dominant wave is currently eyeing a primary target around the RM3.30 region.
Identifying these Motive Waves (Waves 1, 3, and 5) is essential for trend followers, as Wave 3 typically represents the strongest and most extended part of the cycle. Looking ahead, once Wave 3 peaks near RM3.30, we anticipate a temporary Wave 4 retracement before a final Wave 5 push towards the long-term target of RM3.81.
This analysis focuses strictly on highlighting the motive sequence. Detailed updates regarding the subsequent corrective structures will only be provided once Wave 5 satisfies the end of its cycle and exhibits clear momentum divergence.
Educational Disclaimer: This chart is for educational purposes and purely based on technical analysis, not a buy/sell call. All entries, stop-loss setups, and RRR are entirely subject to your own risk evaluation. The author assumes no responsibility for market volatility or potential third-party manipulation/pump-and-dump anomalies. Always DYOR.
Following the completion of Wave 1 and a healthy Wave 2 correction that held firmly above the critical RM1.46 support, the market is currently accelerating within a powerful Wave 3. Backed by Fibonacci extension levels, this dominant wave is currently eyeing a primary target around the RM3.30 region.
Identifying these Motive Waves (Waves 1, 3, and 5) is essential for trend followers, as Wave 3 typically represents the strongest and most extended part of the cycle. Looking ahead, once Wave 3 peaks near RM3.30, we anticipate a temporary Wave 4 retracement before a final Wave 5 push towards the long-term target of RM3.81.
This analysis focuses strictly on highlighting the motive sequence. Detailed updates regarding the subsequent corrective structures will only be provided once Wave 5 satisfies the end of its cycle and exhibits clear momentum divergence.
Educational Disclaimer: This chart is for educational purposes and purely based on technical analysis, not a buy/sell call. All entries, stop-loss setups, and RRR are entirely subject to your own risk evaluation. The author assumes no responsibility for market volatility or potential third-party manipulation/pump-and-dump anomalies. Always DYOR.

Haftungsausschluss
Die Informationen und Veröffentlichungen sind nicht als Finanz-, Anlage-, Handels- oder andere Arten von Ratschlägen oder Empfehlungen gedacht, die von TradingView bereitgestellt oder gebilligt werden, und stellen diese nicht dar. Lesen Sie mehr in den Nutzungsbedingungen.
Haftungsausschluss
Die Informationen und Veröffentlichungen sind nicht als Finanz-, Anlage-, Handels- oder andere Arten von Ratschlägen oder Empfehlungen gedacht, die von TradingView bereitgestellt oder gebilligt werden, und stellen diese nicht dar. Lesen Sie mehr in den Nutzungsbedingungen.