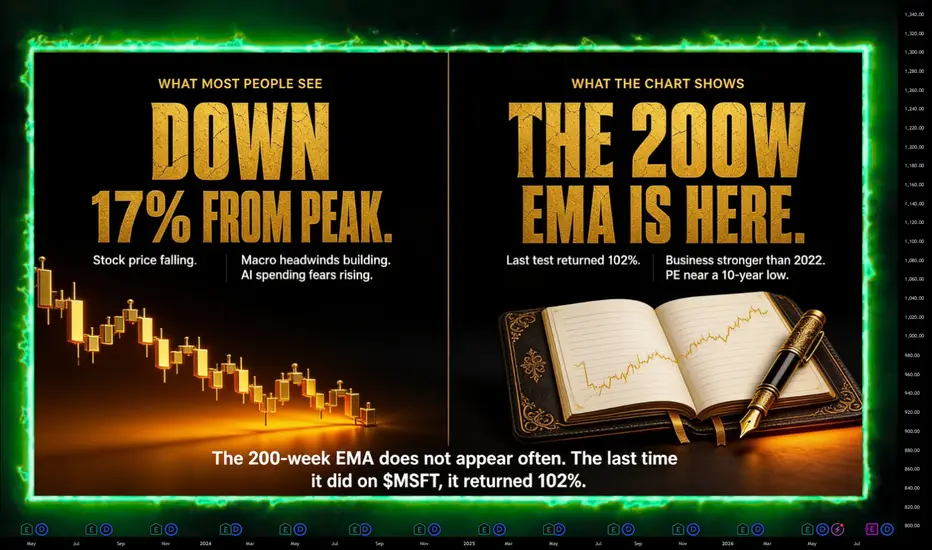
Microsoft  MSFT is sitting at $390.74, touching the 200-week EMA for the first time since the 2022 low at $222. That prior test produced a 102% return before the next consolidation. The current setup is worth mapping clearly.
The chart structure
The 200-week EMA is now acting as dynamic support at the $385 to $395 zone. The 50-week EMA remains above the 200-week EMA confirming the long-term uptrend is technically intact despite the 17% pullback from highs. The DeMarker on the weekly is approaching the exhaustion zone that has historically marked major swing lows across large-cap technology names.
The two measured move targets on the chart
The first box on the chart shows the prior 2022 to 2024 move of 102%, measured from the 200-week EMA entry at $222 to the $449 breakout level. The second box projects an equivalent move from the current 200-week EMA test at $390, producing a measured target of $779.74, labelled on the chart as the 100.52% move target.
Target 1 at $490 to $500 is the return to the prior EMA cluster and consolidation zone. Target 2 at $779.74 is the full measured move extension.
Risk level
A weekly close and hold below $340 would place price below the 200-week EMA on a sustained basis, invalidating the long-term accumulation thesis. That is the stop level for any long-term position entered in the current zone.
Context
The PE ratio at 23.26 is 25% below the 10-year historical average of 31. Azure grew 40% in the most recent quarter. EPS of $16.80 represents 30% year-on-year growth. The business fundamentals support the technical signal rather than contradicting it.
Let price confirm the hold above the 200-week EMA before adding aggressively. A weekly close above $420 with the EMA cluster turning supportive would be the structural confirmation signal.
Not financial advice. All levels are for analytical purposes only.
MSFT is sitting at $390.74, touching the 200-week EMA for the first time since the 2022 low at $222. That prior test produced a 102% return before the next consolidation. The current setup is worth mapping clearly.The chart structure
The 200-week EMA is now acting as dynamic support at the $385 to $395 zone. The 50-week EMA remains above the 200-week EMA confirming the long-term uptrend is technically intact despite the 17% pullback from highs. The DeMarker on the weekly is approaching the exhaustion zone that has historically marked major swing lows across large-cap technology names.
The two measured move targets on the chart
The first box on the chart shows the prior 2022 to 2024 move of 102%, measured from the 200-week EMA entry at $222 to the $449 breakout level. The second box projects an equivalent move from the current 200-week EMA test at $390, producing a measured target of $779.74, labelled on the chart as the 100.52% move target.
Target 1 at $490 to $500 is the return to the prior EMA cluster and consolidation zone. Target 2 at $779.74 is the full measured move extension.
Risk level
A weekly close and hold below $340 would place price below the 200-week EMA on a sustained basis, invalidating the long-term accumulation thesis. That is the stop level for any long-term position entered in the current zone.
Context
The PE ratio at 23.26 is 25% below the 10-year historical average of 31. Azure grew 40% in the most recent quarter. EPS of $16.80 represents 30% year-on-year growth. The business fundamentals support the technical signal rather than contradicting it.
Let price confirm the hold above the 200-week EMA before adding aggressively. A weekly close above $420 with the EMA cluster turning supportive would be the structural confirmation signal.
Not financial advice. All levels are for analytical purposes only.

⭐ Follow the 3-Gate System - tradedesk.rbtrading.site
⭐ Prop Firm Deals - linktr.ee/rb_tradingltd
⭐ #1 Free Trading Journal Lite | +20% Off Pro code RBT20 - rbtrading.site/?ref=RBT20
⭐ Prop Firm Deals - linktr.ee/rb_tradingltd
⭐ #1 Free Trading Journal Lite | +20% Off Pro code RBT20 - rbtrading.site/?ref=RBT20
Haftungsausschluss
Die Informationen und Veröffentlichungen sind nicht als Finanz-, Anlage-, Handels- oder andere Arten von Ratschlägen oder Empfehlungen gedacht, die von TradingView bereitgestellt oder gebilligt werden, und stellen diese nicht dar. Lesen Sie mehr in den Nutzungsbedingungen.
⭐ Follow the 3-Gate System - tradedesk.rbtrading.site
⭐ Prop Firm Deals - linktr.ee/rb_tradingltd
⭐ #1 Free Trading Journal Lite | +20% Off Pro code RBT20 - rbtrading.site/?ref=RBT20
⭐ Prop Firm Deals - linktr.ee/rb_tradingltd
⭐ #1 Free Trading Journal Lite | +20% Off Pro code RBT20 - rbtrading.site/?ref=RBT20
Haftungsausschluss
Die Informationen und Veröffentlichungen sind nicht als Finanz-, Anlage-, Handels- oder andere Arten von Ratschlägen oder Empfehlungen gedacht, die von TradingView bereitgestellt oder gebilligt werden, und stellen diese nicht dar. Lesen Sie mehr in den Nutzungsbedingungen.