
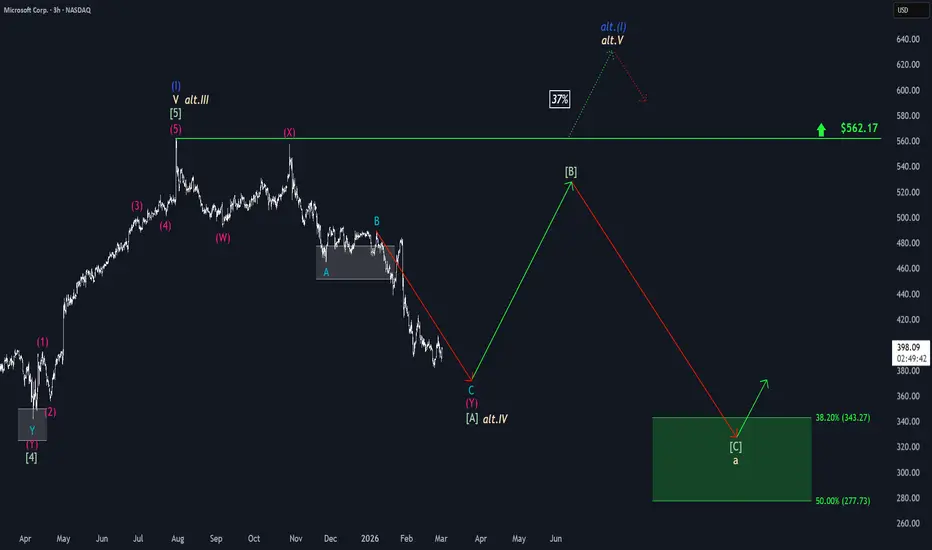
The low of the green wave [A] is getting closer. Once it has been established, we initially expect a noticeable recovery in wave [B]. However, this countermovement is likely to be only temporary before the sell-off of the higher-level beige wave a continues (still below the resistance at $562.17) and ultimately leads MSFT into our green Long Target Zone between $343.27 and $277.73. With a probability of 37%, the stock could be forming the low of the beige wave alt.IV. In this case, a dynamic rise would be expected afterward, which would carry price above the resistance at $562.17 as part of the higher-level blue wave alt.(I).

📊 Daily market insights combining macro + Elliott Wave analysis
🚀 Spot trends early with momentum, sentiment & price structure
🌐 Join thousands trading smarter at hkcmglobal.com
🚀 Spot trends early with momentum, sentiment & price structure
🌐 Join thousands trading smarter at hkcmglobal.com
Verbundene Veröffentlichungen
Haftungsausschluss
Die Informationen und Veröffentlichungen sind nicht als Finanz-, Anlage-, Handels- oder andere Arten von Ratschlägen oder Empfehlungen gedacht, die von TradingView bereitgestellt oder gebilligt werden, und stellen diese nicht dar. Lesen Sie mehr in den Nutzungsbedingungen.