
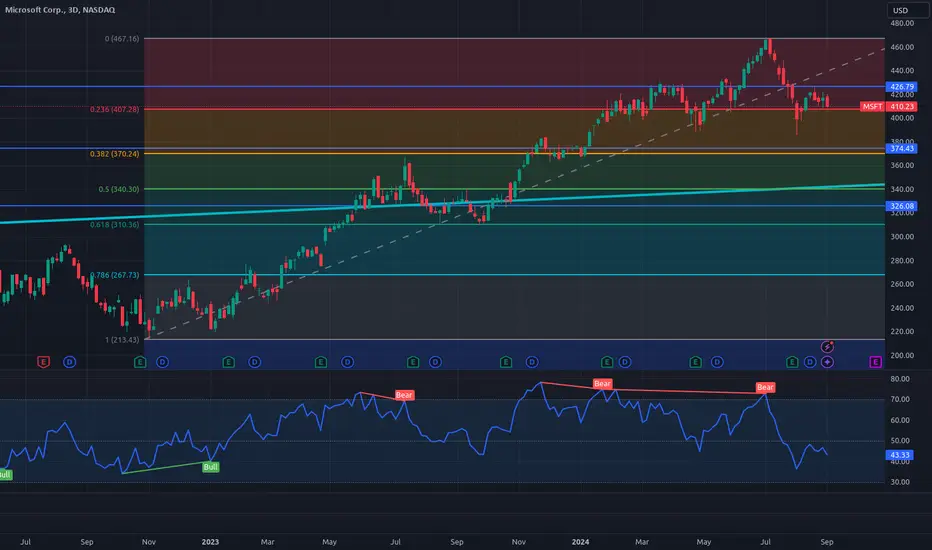
The biggest stocks in the market, from the technology sector, tops on July 2024. Now they are showing some concerning data. The weak RSI and Fibonacci retracement levels perfectly match previous support and resistance levels. There are also other concerning factors.
Microsoft is showing a weak RSI in the latest move-ups. Maybe it needs to find liquidity in the 0.382 FIB level around 370$.
Microsoft is showing a weak RSI in the latest move-ups. Maybe it needs to find liquidity in the 0.382 FIB level around 370$.

Verbundene Veröffentlichungen
Haftungsausschluss
Die Informationen und Veröffentlichungen sind nicht als Finanz-, Anlage-, Handels- oder andere Arten von Ratschlägen oder Empfehlungen gedacht, die von TradingView bereitgestellt oder gebilligt werden, und stellen diese nicht dar. Lesen Sie mehr in den Nutzungsbedingungen.
Verbundene Veröffentlichungen
Haftungsausschluss
Die Informationen und Veröffentlichungen sind nicht als Finanz-, Anlage-, Handels- oder andere Arten von Ratschlägen oder Empfehlungen gedacht, die von TradingView bereitgestellt oder gebilligt werden, und stellen diese nicht dar. Lesen Sie mehr in den Nutzungsbedingungen.