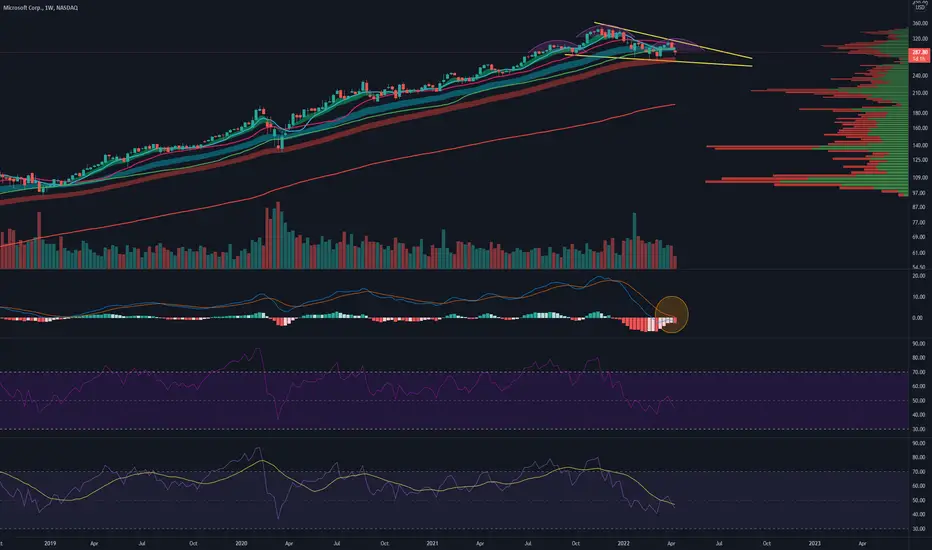
Bull Scenario = Falling wedge with a push off the 72/89 EMA cloud.
Bear Scenario = Inverted head and shoulders pattern with a failed bounce off the 72/89 EMA.
MACD may be stalling and curling. This is a weekly chart so a bit more macro.
 MSFT
MSFT
Bear Scenario = Inverted head and shoulders pattern with a failed bounce off the 72/89 EMA.
MACD may be stalling and curling. This is a weekly chart so a bit more macro.
MSFTAnmerkung
Looking more and more bearish. Testing that 72/89 EMA cloud. If it starts to really test that lower trend line of the wedge, I think that we're going to see the price fall. Given macro trends, I think the market is pricing this in now vs. the future when additional rate hikes happen.Anmerkung
Once again testing the 72/89 EMA cloud further. Downside targets would be $233 and $213 if it falls out to the downside.
Haftungsausschluss
Die Informationen und Veröffentlichungen sind nicht als Finanz-, Anlage-, Handels- oder andere Arten von Ratschlägen oder Empfehlungen gedacht, die von TradingView bereitgestellt oder gebilligt werden, und stellen diese nicht dar. Lesen Sie mehr in den Nutzungsbedingungen.
Haftungsausschluss
Die Informationen und Veröffentlichungen sind nicht als Finanz-, Anlage-, Handels- oder andere Arten von Ratschlägen oder Empfehlungen gedacht, die von TradingView bereitgestellt oder gebilligt werden, und stellen diese nicht dar. Lesen Sie mehr in den Nutzungsbedingungen.