
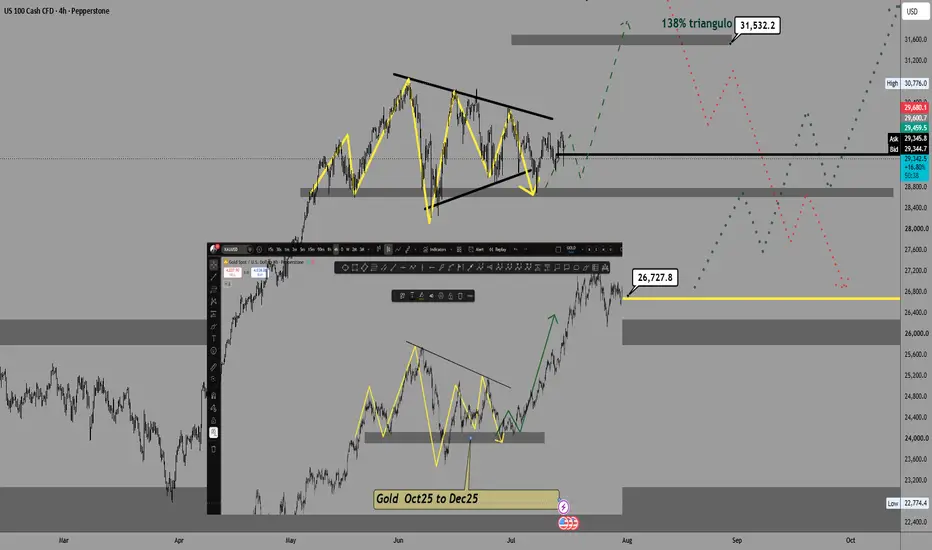
I’ve been observing a very interesting structure in the Nasdaq (NAS100) since May 26th. Upon comparing the charts, I’ve noticed a remarkable technical correlation with the formation that Gold (XAU/USD) displayed between October and December of last year.
As you can see in the chart, the consolidation/triangle pattern is almost a mirror image. If the market respects this fractal structure, we could be looking at a bullish continuation signal similar to the one Gold executed back then.
What do you think? Are we seeing a repetition of algorithmic behavior, or just a technical coincidence? Let me know your thoughts in the comments.
As you can see in the chart, the consolidation/triangle pattern is almost a mirror image. If the market respects this fractal structure, we could be looking at a bullish continuation signal similar to the one Gold executed back then.
What do you think? Are we seeing a repetition of algorithmic behavior, or just a technical coincidence? Let me know your thoughts in the comments.

Haftungsausschluss
Die Informationen und Veröffentlichungen sind nicht als Finanz-, Anlage-, Handels- oder andere Arten von Ratschlägen oder Empfehlungen gedacht, die von TradingView bereitgestellt oder gebilligt werden, und stellen diese nicht dar. Lesen Sie mehr in den Nutzungsbedingungen.
Haftungsausschluss
Die Informationen und Veröffentlichungen sind nicht als Finanz-, Anlage-, Handels- oder andere Arten von Ratschlägen oder Empfehlungen gedacht, die von TradingView bereitgestellt oder gebilligt werden, und stellen diese nicht dar. Lesen Sie mehr in den Nutzungsbedingungen.