US Tech 100 ( NDX) Daily: Testing Key Support Shelf at 28,242 – Potential 200-EMA Correction Trigger
### 🇺🇸 US Tech 100 Cash (NASDAQ) Daily Structural Analysis (Ref: NASDAQ_2026-07-17_09-23-30.png)
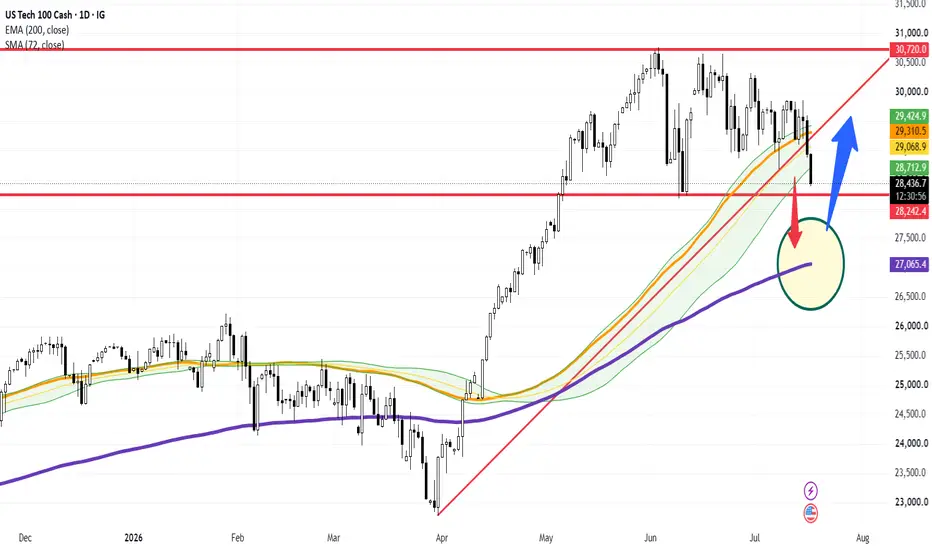
We are tracking a critical structural pivot on the US Tech 100 (NASDAQ) daily (1D) interval. After printing a historic double-top style distribution pattern near the **30,720.00** major supply zone, the index has experienced a sharp technical markdown, slicing through key trend dynamics.
The index is currently trading under significant pressure at **28,404.60 (-1.87%)**, fast-approaching a major make-or-break horizontal baseline.
---
### 🔍 Key Technical Structures & Breakout Mechanics:
1. **The Primary Trendline Breakdown:** The aggressive daily candle has officially broken below the long-term **Ascending Support Trendline (red diagonal LTA)** which had anchored the entire bullish trend since the major bottom near **23,000** in April.
2. **The Dynamic EMA/SMA Squeeze:** Price has also closed cleanly below both the **72-period SMA (yellow line currently at 29,310.10)** and the short-term EMA band, invalidating previous dynamic support clusters.
3. **The Line in the Sand (28,242.40):** The immediate focus of this study is the critical horizontal support shelf plotted at **28,242.40** (the lower red horizontal line). This level marks the ultimate structural defense for buyers.
---
### 📉 Bearish Continuation: Target 200-EMA (27,200 - 27,000)
As highlighted by our red downward tracking vector inside the target circle:
* **The Daily Close Confirmation Trigger:** If the daily candle registers a confirmed close **below 28,242.40**, the local bearish momentum will be officially validated, confirming a structural shift from "pullback" to a "deeper corrective cycle".
* **First Major Target - The 200-EMA Cluster:** Breaking this floor opens a direct technical vacuum down to the **200-period EMA (purple line currently rising at 27,065.10)**. This institutional average converges beautifully with the demand zone of **27,200.00 - 27,000.00** (previous consolidation and structural gap from May). This is where major players are highly likely to step in to defend the long-term trend.
---
### 🔄 Alternative Bullish Scenario (The Blue Vector)
* **The Liquidity Sweep & Spring:** Traders should watch for a potential "bear trap." If the index sweeps below 28,240 to grab sell-stops but quickly recovers to close the day back above the support line, it would print a bullish rejection candle (e.g., hammer or pin bar).
* Such a reaction could trigger a sharp relief rally (blue arrow) back toward the broken LTA and the 72-SMA area (~29,310) to retest the newly formed resistance.
### 📊 Tactical Trading Parameters:
* **Current Bias:** Neutral-Bearish (testing major support)
* **Major Breakdown Trigger:** Confirmed Daily Close below 28,242.40
* **Downside Targets:** 27,200.00 - 27,065.00 (200-EMA Area)
* **Upside Resistance:** 29,310.10 (72-SMA) & 29,424.80
* **Invalidation Anchor:** Daily Close reclaiming a position back above 29,425.00
---
📊 **ChartPro Data**
*US Tech Architecture, Structural Range Breakouts & High-Probability Trend Confluences.*
⚠️ **Disclaimer:** For educational and informational purposes only. This active market study represents a personal trading framework and does not constitute financial or investment advice.
NDX) Daily: Testing Key Support Shelf at 28,242 – Potential 200-EMA Correction Trigger### 🇺🇸 US Tech 100 Cash (NASDAQ) Daily Structural Analysis (Ref: NASDAQ_2026-07-17_09-23-30.png)
We are tracking a critical structural pivot on the US Tech 100 (NASDAQ) daily (1D) interval. After printing a historic double-top style distribution pattern near the **30,720.00** major supply zone, the index has experienced a sharp technical markdown, slicing through key trend dynamics.
The index is currently trading under significant pressure at **28,404.60 (-1.87%)**, fast-approaching a major make-or-break horizontal baseline.
---
### 🔍 Key Technical Structures & Breakout Mechanics:
1. **The Primary Trendline Breakdown:** The aggressive daily candle has officially broken below the long-term **Ascending Support Trendline (red diagonal LTA)** which had anchored the entire bullish trend since the major bottom near **23,000** in April.
2. **The Dynamic EMA/SMA Squeeze:** Price has also closed cleanly below both the **72-period SMA (yellow line currently at 29,310.10)** and the short-term EMA band, invalidating previous dynamic support clusters.
3. **The Line in the Sand (28,242.40):** The immediate focus of this study is the critical horizontal support shelf plotted at **28,242.40** (the lower red horizontal line). This level marks the ultimate structural defense for buyers.
---
### 📉 Bearish Continuation: Target 200-EMA (27,200 - 27,000)
As highlighted by our red downward tracking vector inside the target circle:
* **The Daily Close Confirmation Trigger:** If the daily candle registers a confirmed close **below 28,242.40**, the local bearish momentum will be officially validated, confirming a structural shift from "pullback" to a "deeper corrective cycle".
* **First Major Target - The 200-EMA Cluster:** Breaking this floor opens a direct technical vacuum down to the **200-period EMA (purple line currently rising at 27,065.10)**. This institutional average converges beautifully with the demand zone of **27,200.00 - 27,000.00** (previous consolidation and structural gap from May). This is where major players are highly likely to step in to defend the long-term trend.
---
### 🔄 Alternative Bullish Scenario (The Blue Vector)
* **The Liquidity Sweep & Spring:** Traders should watch for a potential "bear trap." If the index sweeps below 28,240 to grab sell-stops but quickly recovers to close the day back above the support line, it would print a bullish rejection candle (e.g., hammer or pin bar).
* Such a reaction could trigger a sharp relief rally (blue arrow) back toward the broken LTA and the 72-SMA area (~29,310) to retest the newly formed resistance.
### 📊 Tactical Trading Parameters:
* **Current Bias:** Neutral-Bearish (testing major support)
* **Major Breakdown Trigger:** Confirmed Daily Close below 28,242.40
* **Downside Targets:** 27,200.00 - 27,065.00 (200-EMA Area)
* **Upside Resistance:** 29,310.10 (72-SMA) & 29,424.80
* **Invalidation Anchor:** Daily Close reclaiming a position back above 29,425.00
---
📊 **ChartPro Data**
*US Tech Architecture, Structural Range Breakouts & High-Probability Trend Confluences.*
⚠️ **Disclaimer:** For educational and informational purposes only. This active market study represents a personal trading framework and does not constitute financial or investment advice.

Haftungsausschluss
Die Informationen und Veröffentlichungen sind nicht als Finanz-, Anlage-, Handels- oder andere Arten von Ratschlägen oder Empfehlungen gedacht, die von TradingView bereitgestellt oder gebilligt werden, und stellen diese nicht dar. Lesen Sie mehr in den Nutzungsbedingungen.
Haftungsausschluss
Die Informationen und Veröffentlichungen sind nicht als Finanz-, Anlage-, Handels- oder andere Arten von Ratschlägen oder Empfehlungen gedacht, die von TradingView bereitgestellt oder gebilligt werden, und stellen diese nicht dar. Lesen Sie mehr in den Nutzungsbedingungen.