
📊 NATCOPHARM – STWP Equity Snapshot
Ticker: NSE: NATCOPHARM
Sector: Pharmaceuticals / Specialty Generics
CMP: 1,000.80 ▲ (+5.00% | 05 Mar 2026)
Learning Rating: ⭐⭐⭐⭐☆ (Breakout Attempt Near Prior Swing High)
Chart Pattern Observed: Bullish Expansion into Resistance Zone
Candlestick Context: Strong Bullish Marubozu-Type Candle with Improving Participation
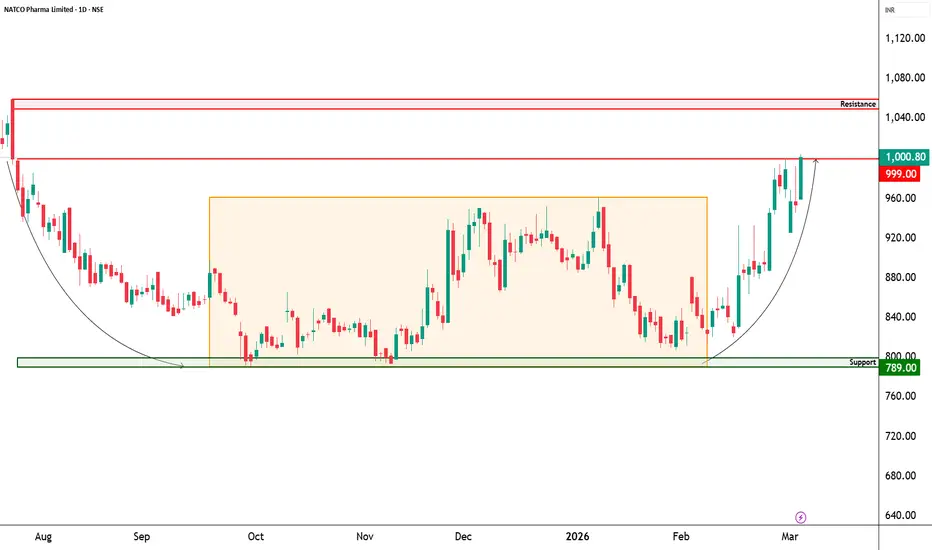
NATCOPHARM has transitioned into a strong upward structure after reclaiming prior consolidation levels and pushing toward the upper boundary of its recent trading range. The latest price action reflects a powerful bullish expansion candle that signals renewed buyer interest as the stock approaches the previous swing high region. The sequence of higher lows forming over the past sessions suggests that buyers are gradually gaining control of the structure.
RSI is currently positioned near 69.86, indicating strong bullish momentum while still remaining just below extreme overbought territory. This typically reflects a healthy trending phase rather than exhaustion. MACD continues to remain positively aligned, supporting the ongoing directional bias. However, price is now approaching an important supply cluster between 1,016 and 1,061, which represents the previous swing high region. Structural confirmation will depend on whether the market can sustain acceptance above this band.
From a CPR perspective, price is trading well above the pivot structure and the projected CPR is widening upward. Such a configuration often supports trend continuation with shallow pullbacks rather than deep retracements. Nevertheless, resistance near prior highs remains a key decision zone where either continuation or temporary consolidation may emerge.
Volume Analysis
Current volume is running above recent average participation with relative volume around 1.16 times normal levels. The move is supported by consistent activity, indicating credible buying interest rather than passive drift. Continuation strength will depend on whether participation expands further as price interacts with the resistance band near the previous swing highs.
Key Levels – Daily Timeframe
Primary support areas are positioned near 971, followed by 942 and 926. On the upside, resistance zones are located around 1,016, 1,032 and 1,061. These areas have previously acted as reaction points and remain important structural levels for continuation or rejection behaviour.
Structure Read – What Matters Now
The most important development is the strong bullish impulse emerging near prior consolidation highs. The immediate focus is on whether price can achieve sustained acceptance above the 1,016–1,061 resistance cluster. Sustained trade below 938 would weaken the current bullish structure and increase the probability of consolidation within the broader range. The primary risk lies in resistance rejection after a rapid expansion. The most probable near-term outcome is either breakout continuation above supply or controlled consolidation below resistance.
Price Reference Framework – Educational View
From an intraday observation perspective, the key reference zone lies around 1,003, with risk invalidation below 956. Upside reference zones are positioned near 1,051 and 1,098. These levels are intended purely for studying short-term price behaviour and participation.
From a swing perspective over the next two to five sessions, the observation zone remains around 1,003, with structural invalidation below 938. Upside reference zones extend toward 1,135 and 1,234, becoming relevant only if price sustains above reclaimed resistance areas.
STWP View
Momentum remains strong while the broader trend continues to point upward. Risk remains elevated due to proximity to the prior swing high resistance zone. Volume is moderate but supportive of the bullish move. Sentiment is bullish, RSI stands at 69.86, and the session recorded a five percent advance.
Final Outlook
Momentum: Strong
Trend: Up
Risk: High
Volume: Moderate
📘 Learning Note
Breakouts near prior swing highs require patience. Confirmation comes not from the first touch of resistance but from sustained acceptance above it.
⚠️ Disclaimer
This analysis is generated strictly for educational and analytical purposes only. All option structures, metrics, scores, interpretations, PCR, Max Pain levels, and volatility commentary are model-based observations derived from uploaded data. This does not constitute investment advice, trading advice, or a recommendation to buy or sell any security or derivative instrument. Options trading involves substantial risk and may not be suitable for all participants. Readers are advised to exercise independent judgment and consult a SEBI-registered financial advisor before taking any trading or investment decisions. STWP assumes no responsibility for any financial loss arising from the use of this analysis.
Ticker: NSE: NATCOPHARM
Sector: Pharmaceuticals / Specialty Generics
CMP: 1,000.80 ▲ (+5.00% | 05 Mar 2026)
Learning Rating: ⭐⭐⭐⭐☆ (Breakout Attempt Near Prior Swing High)
Chart Pattern Observed: Bullish Expansion into Resistance Zone
Candlestick Context: Strong Bullish Marubozu-Type Candle with Improving Participation
NATCOPHARM has transitioned into a strong upward structure after reclaiming prior consolidation levels and pushing toward the upper boundary of its recent trading range. The latest price action reflects a powerful bullish expansion candle that signals renewed buyer interest as the stock approaches the previous swing high region. The sequence of higher lows forming over the past sessions suggests that buyers are gradually gaining control of the structure.
RSI is currently positioned near 69.86, indicating strong bullish momentum while still remaining just below extreme overbought territory. This typically reflects a healthy trending phase rather than exhaustion. MACD continues to remain positively aligned, supporting the ongoing directional bias. However, price is now approaching an important supply cluster between 1,016 and 1,061, which represents the previous swing high region. Structural confirmation will depend on whether the market can sustain acceptance above this band.
From a CPR perspective, price is trading well above the pivot structure and the projected CPR is widening upward. Such a configuration often supports trend continuation with shallow pullbacks rather than deep retracements. Nevertheless, resistance near prior highs remains a key decision zone where either continuation or temporary consolidation may emerge.
Volume Analysis
Current volume is running above recent average participation with relative volume around 1.16 times normal levels. The move is supported by consistent activity, indicating credible buying interest rather than passive drift. Continuation strength will depend on whether participation expands further as price interacts with the resistance band near the previous swing highs.
Key Levels – Daily Timeframe
Primary support areas are positioned near 971, followed by 942 and 926. On the upside, resistance zones are located around 1,016, 1,032 and 1,061. These areas have previously acted as reaction points and remain important structural levels for continuation or rejection behaviour.
Structure Read – What Matters Now
The most important development is the strong bullish impulse emerging near prior consolidation highs. The immediate focus is on whether price can achieve sustained acceptance above the 1,016–1,061 resistance cluster. Sustained trade below 938 would weaken the current bullish structure and increase the probability of consolidation within the broader range. The primary risk lies in resistance rejection after a rapid expansion. The most probable near-term outcome is either breakout continuation above supply or controlled consolidation below resistance.
Price Reference Framework – Educational View
From an intraday observation perspective, the key reference zone lies around 1,003, with risk invalidation below 956. Upside reference zones are positioned near 1,051 and 1,098. These levels are intended purely for studying short-term price behaviour and participation.
From a swing perspective over the next two to five sessions, the observation zone remains around 1,003, with structural invalidation below 938. Upside reference zones extend toward 1,135 and 1,234, becoming relevant only if price sustains above reclaimed resistance areas.
STWP View
Momentum remains strong while the broader trend continues to point upward. Risk remains elevated due to proximity to the prior swing high resistance zone. Volume is moderate but supportive of the bullish move. Sentiment is bullish, RSI stands at 69.86, and the session recorded a five percent advance.
Final Outlook
Momentum: Strong
Trend: Up
Risk: High
Volume: Moderate
📘 Learning Note
Breakouts near prior swing highs require patience. Confirmation comes not from the first touch of resistance but from sustained acceptance above it.
⚠️ Disclaimer
This analysis is generated strictly for educational and analytical purposes only. All option structures, metrics, scores, interpretations, PCR, Max Pain levels, and volatility commentary are model-based observations derived from uploaded data. This does not constitute investment advice, trading advice, or a recommendation to buy or sell any security or derivative instrument. Options trading involves substantial risk and may not be suitable for all participants. Readers are advised to exercise independent judgment and consult a SEBI-registered financial advisor before taking any trading or investment decisions. STWP assumes no responsibility for any financial loss arising from the use of this analysis.

STWP | Mentor & Demand-Supply Specialist |
Empowering traders through structured learning |
simpletradewithpatience.com
Community: chat.whatsapp.com/BEYz0tkqP0fJPBCWf59uel
wa.me/message/6IOPHGOXMGZ4N1
Educational Only
Empowering traders through structured learning |
simpletradewithpatience.com
Community: chat.whatsapp.com/BEYz0tkqP0fJPBCWf59uel
wa.me/message/6IOPHGOXMGZ4N1
Educational Only
Haftungsausschluss
Die Informationen und Veröffentlichungen sind nicht als Finanz-, Anlage-, Handels- oder andere Arten von Ratschlägen oder Empfehlungen gedacht, die von TradingView bereitgestellt oder gebilligt werden, und stellen diese nicht dar. Lesen Sie mehr in den Nutzungsbedingungen.
STWP | Mentor & Demand-Supply Specialist |
Empowering traders through structured learning |
simpletradewithpatience.com
Community: chat.whatsapp.com/BEYz0tkqP0fJPBCWf59uel
wa.me/message/6IOPHGOXMGZ4N1
Educational Only
Empowering traders through structured learning |
simpletradewithpatience.com
Community: chat.whatsapp.com/BEYz0tkqP0fJPBCWf59uel
wa.me/message/6IOPHGOXMGZ4N1
Educational Only
Haftungsausschluss
Die Informationen und Veröffentlichungen sind nicht als Finanz-, Anlage-, Handels- oder andere Arten von Ratschlägen oder Empfehlungen gedacht, die von TradingView bereitgestellt oder gebilligt werden, und stellen diese nicht dar. Lesen Sie mehr in den Nutzungsbedingungen.