
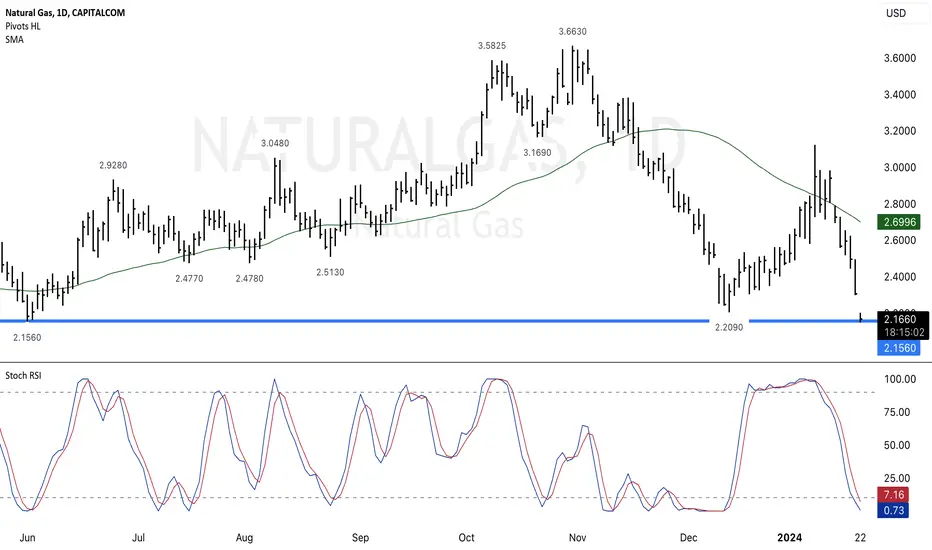
Double Bottom Oversold Stoch RSI. The technical analysis indicates a Double Bottom pattern along with an Oversold condition in the Stochastic RSI. This combination suggests a potential reversal or a bullish momentum in the market. The Double Bottom pattern is characterized by two consecutive troughs at approximately the same price level, indicating a possible trend reversal from a downtrend to an uptrend. Additionally, the Oversold condition in the Stochastic RSI suggests that the asset may have been oversold and could be due for a price increase. Traders may interpret this as a signal to consider buying or taking a bullish stance in their trading strategy.

Haftungsausschluss
Die Informationen und Veröffentlichungen sind nicht als Finanz-, Anlage-, Handels- oder andere Arten von Ratschlägen oder Empfehlungen gedacht, die von TradingView bereitgestellt oder gebilligt werden, und stellen diese nicht dar. Lesen Sie mehr in den Nutzungsbedingungen.
Haftungsausschluss
Die Informationen und Veröffentlichungen sind nicht als Finanz-, Anlage-, Handels- oder andere Arten von Ratschlägen oder Empfehlungen gedacht, die von TradingView bereitgestellt oder gebilligt werden, und stellen diese nicht dar. Lesen Sie mehr in den Nutzungsbedingungen.