Long
NCASH Potential Bottom
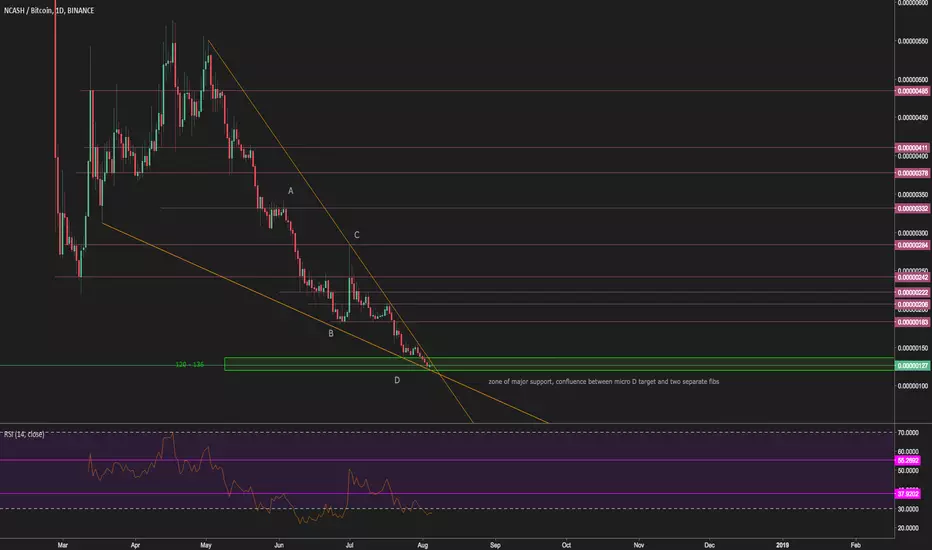
Ncash has seen a rough couple months. However we're now seeing an extremely oversold RSI in confluence with multiple fib levels and a strong trend extension (marked ABCD).
Here I'm looking for a potential bottom within the green box. Pink lines are simple levels of resistance, where price is likely to react. Any of these lines may be looked at as potential targets. I may post extra charts in comments to highlight the specific retracements I've used to find this zone.
Entry Zone : 120-136
Short Term Targets -
Target 1 : 160
Target 2 : 181
Target 3 : 203
Target 4 : 222
Long Term Targets -
Target 1 : 240
Target 2 : 282
Target 3 : 330
Target 4 : 375
Stop Loss : 111 (at your own discretion, this is my personal SL)
I'm not a financial advisor. Happy trading

Haftungsausschluss
Die Informationen und Veröffentlichungen sind nicht als Finanz-, Anlage-, Handels- oder andere Arten von Ratschlägen oder Empfehlungen gedacht, die von TradingView bereitgestellt oder gebilligt werden, und stellen diese nicht dar. Lesen Sie mehr in den Nutzungsbedingungen.
Haftungsausschluss
Die Informationen und Veröffentlichungen sind nicht als Finanz-, Anlage-, Handels- oder andere Arten von Ratschlägen oder Empfehlungen gedacht, die von TradingView bereitgestellt oder gebilligt werden, und stellen diese nicht dar. Lesen Sie mehr in den Nutzungsbedingungen.