
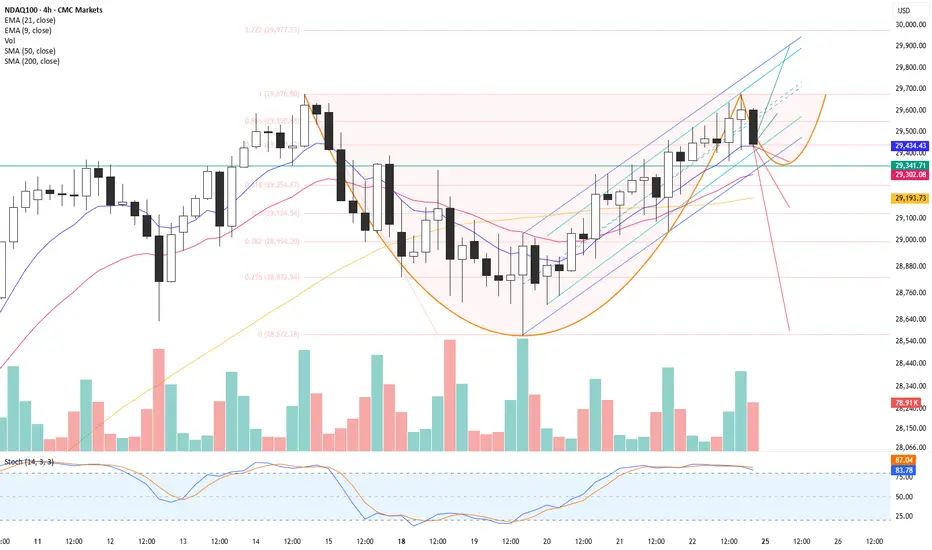
The pattern visible on the H4 chart is a potential pro-L bottom, for which the so-called “ear” has begun to form (another name for this formation is the “cup and handle,” and now the “handle” is forming).
Bullish Scenario: The range is marked roughly, as formations are never perfect. Once it forms (there may still be a few candles, or perhaps just one), we’ll see a sharp rise to the 1.618% Fibonacci extension level.
The bearish scenario is a breakout of the formation and a drop below 40-50% of the cup formation’s height.
As usual, the green lines indicate upward movement and the red lines downward movement.
Additionally, the current upward movement from the low can be fitted into a two-width upward channel.
Przemyslaw Blachut - May profit be with you :)
Bullish Scenario: The range is marked roughly, as formations are never perfect. Once it forms (there may still be a few candles, or perhaps just one), we’ll see a sharp rise to the 1.618% Fibonacci extension level.
The bearish scenario is a breakout of the formation and a drop below 40-50% of the cup formation’s height.
As usual, the green lines indicate upward movement and the red lines downward movement.
Additionally, the current upward movement from the low can be fitted into a two-width upward channel.
Przemyslaw Blachut - May profit be with you :)

Haftungsausschluss
Die Informationen und Veröffentlichungen sind nicht als Finanz-, Anlage-, Handels- oder andere Arten von Ratschlägen oder Empfehlungen gedacht, die von TradingView bereitgestellt oder gebilligt werden, und stellen diese nicht dar. Lesen Sie mehr in den Nutzungsbedingungen.
Haftungsausschluss
Die Informationen und Veröffentlichungen sind nicht als Finanz-, Anlage-, Handels- oder andere Arten von Ratschlägen oder Empfehlungen gedacht, die von TradingView bereitgestellt oder gebilligt werden, und stellen diese nicht dar. Lesen Sie mehr in den Nutzungsbedingungen.