
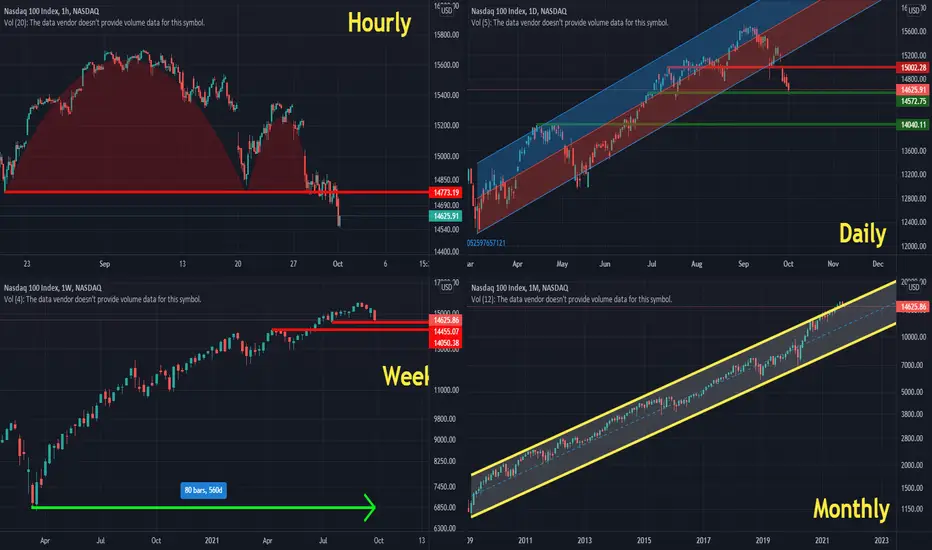
Hourly Chart: Reverse cup and handle pattern (Bearish)
Daily Chart: getting out of Bullish regression Channel and Higher-high higher-low pattern(Bearish)
Weekly Chart: Closing at lower levels for 4 weeks in a row for the first time in the past 80 weeks! (Bearish)
Monthly Chart: September was the Biggest monthly negative candle (-5.73%) in the past 18 months! (Bearish)
Conclusion: I believe this could continue for the next 2-3 weeks and we may find a support level near 14050 level.
Being patient in a market like this will pay off and provide good opportunities, however, you should not forget the best friend you have in the market is your "Stop Loss".
Daily Chart: getting out of Bullish regression Channel and Higher-high higher-low pattern(Bearish)
Weekly Chart: Closing at lower levels for 4 weeks in a row for the first time in the past 80 weeks! (Bearish)
Monthly Chart: September was the Biggest monthly negative candle (-5.73%) in the past 18 months! (Bearish)
Conclusion: I believe this could continue for the next 2-3 weeks and we may find a support level near 14050 level.
Being patient in a market like this will pay off and provide good opportunities, however, you should not forget the best friend you have in the market is your "Stop Loss".

Use the following link to access trading ideas: patreon.com/SniperTraderStocks?utm_medium=unknown&utm_source=join_link&utm_campaign=creatorshare_creator&utm_content=copyLink
Haftungsausschluss
Die Informationen und Veröffentlichungen sind nicht als Finanz-, Anlage-, Handels- oder andere Arten von Ratschlägen oder Empfehlungen gedacht, die von TradingView bereitgestellt oder gebilligt werden, und stellen diese nicht dar. Lesen Sie mehr in den Nutzungsbedingungen.
Use the following link to access trading ideas: patreon.com/SniperTraderStocks?utm_medium=unknown&utm_source=join_link&utm_campaign=creatorshare_creator&utm_content=copyLink
Haftungsausschluss
Die Informationen und Veröffentlichungen sind nicht als Finanz-, Anlage-, Handels- oder andere Arten von Ratschlägen oder Empfehlungen gedacht, die von TradingView bereitgestellt oder gebilligt werden, und stellen diese nicht dar. Lesen Sie mehr in den Nutzungsbedingungen.