
Definitely, it is one of the most hyped crypto projects of this cycle. However, its price movement appears to be supported not only by hype and influencers, but also by improving fundamentals.
I invested a decent portion of my capital into NEAR Protocol last Saturday when the price was around $2 USD, based on the following technical factors.
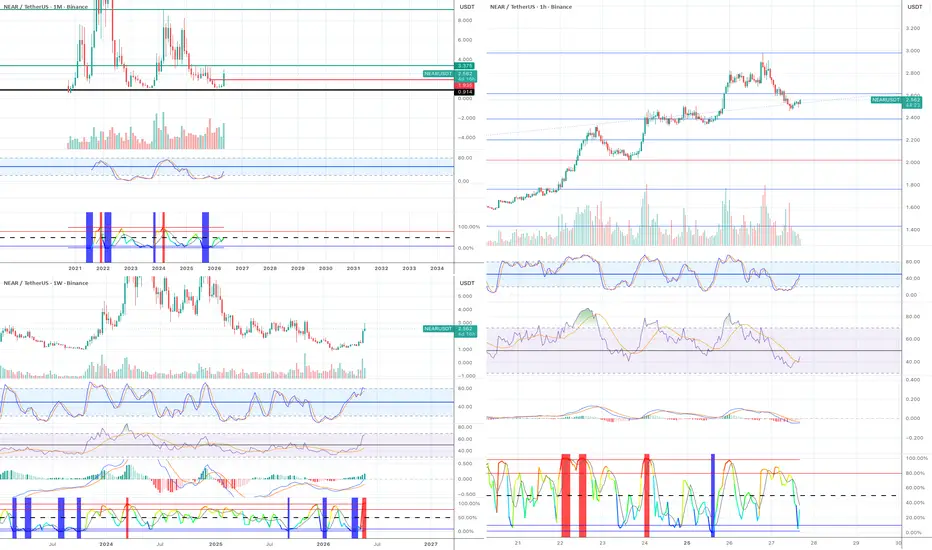
On the monthly chart, volatility was starting to expand to the upside according to BBWP. The stochastic indicator had reached oversold territory and was beginning to turn upward. In addition, the price was rising on strong volume.
On the weekly chart, the MACD, RSI, and stochastic indicators had all freshly entered bullish territory, while the price structure was forming higher highs.
The rally over the past few days was extremely sharp, so it was natural to see profit-taking just below the $3 range. I took some profits, but I am still in the market overall.
For now, I am waiting for a pullback. I am using the daily chart to watch for a retracement toward the Fibonacci 0.5 and 0.618 levels. However, if demand remains very strong, the price may only retrace to the 0.382 level before continuing higher.
I will then use the 1-hour chart for confirmation. If the price pulls back and begins forming higher highs and higher lows again and also if the RSI and MACD re-enter bullish territory while the BBWP volatility indicator compresses and then begins expanding to the upside again, I will add more to my position.
I invested a decent portion of my capital into NEAR Protocol last Saturday when the price was around $2 USD, based on the following technical factors.
On the monthly chart, volatility was starting to expand to the upside according to BBWP. The stochastic indicator had reached oversold territory and was beginning to turn upward. In addition, the price was rising on strong volume.
On the weekly chart, the MACD, RSI, and stochastic indicators had all freshly entered bullish territory, while the price structure was forming higher highs.
The rally over the past few days was extremely sharp, so it was natural to see profit-taking just below the $3 range. I took some profits, but I am still in the market overall.
For now, I am waiting for a pullback. I am using the daily chart to watch for a retracement toward the Fibonacci 0.5 and 0.618 levels. However, if demand remains very strong, the price may only retrace to the 0.382 level before continuing higher.
I will then use the 1-hour chart for confirmation. If the price pulls back and begins forming higher highs and higher lows again and also if the RSI and MACD re-enter bullish territory while the BBWP volatility indicator compresses and then begins expanding to the upside again, I will add more to my position.

Verbundene Veröffentlichungen
Haftungsausschluss
Die Informationen und Veröffentlichungen sind nicht als Finanz-, Anlage-, Handels- oder andere Arten von Ratschlägen oder Empfehlungen gedacht, die von TradingView bereitgestellt oder gebilligt werden, und stellen diese nicht dar. Lesen Sie mehr in den Nutzungsbedingungen.
Verbundene Veröffentlichungen
Haftungsausschluss
Die Informationen und Veröffentlichungen sind nicht als Finanz-, Anlage-, Handels- oder andere Arten von Ratschlägen oder Empfehlungen gedacht, die von TradingView bereitgestellt oder gebilligt werden, und stellen diese nicht dar. Lesen Sie mehr in den Nutzungsbedingungen.