Long
This is what I see right now
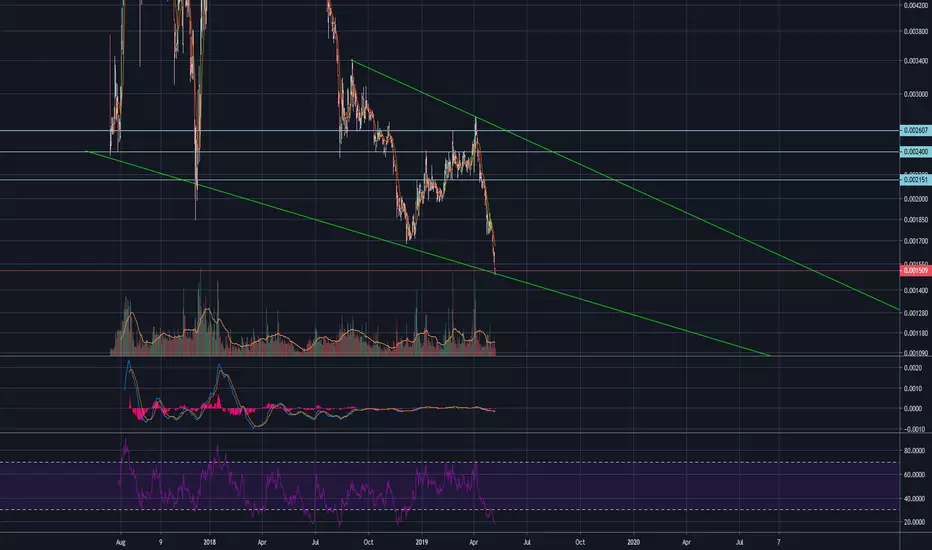
FYI my trend lines are drawn on the monthly.
To me it appears NEO is hitting the bottom trend line in a falling wedge, from here we either break below 1500 and free fall as others are saying, or we hold and bounce back to the upper trend line of the falling wedge. What do you think?
To me it appears NEO is hitting the bottom trend line in a falling wedge, from here we either break below 1500 and free fall as others are saying, or we hold and bounce back to the upper trend line of the falling wedge. What do you think?
Anmerkung
The daily candle wicked under the trend line and pulled back inside into a bullish hammer before closing. This is a good sign in my opinionAnmerkung
Dropped out of the wedge and also back under the monthly long term downtrend line since Feb 2018. Where NEOBTC lands now is anyones guess.
Haftungsausschluss
Die Informationen und Veröffentlichungen sind nicht als Finanz-, Anlage-, Handels- oder andere Arten von Ratschlägen oder Empfehlungen gedacht, die von TradingView bereitgestellt oder gebilligt werden, und stellen diese nicht dar. Lesen Sie mehr in den Nutzungsbedingungen.
Haftungsausschluss
Die Informationen und Veröffentlichungen sind nicht als Finanz-, Anlage-, Handels- oder andere Arten von Ratschlägen oder Empfehlungen gedacht, die von TradingView bereitgestellt oder gebilligt werden, und stellen diese nicht dar. Lesen Sie mehr in den Nutzungsbedingungen.