
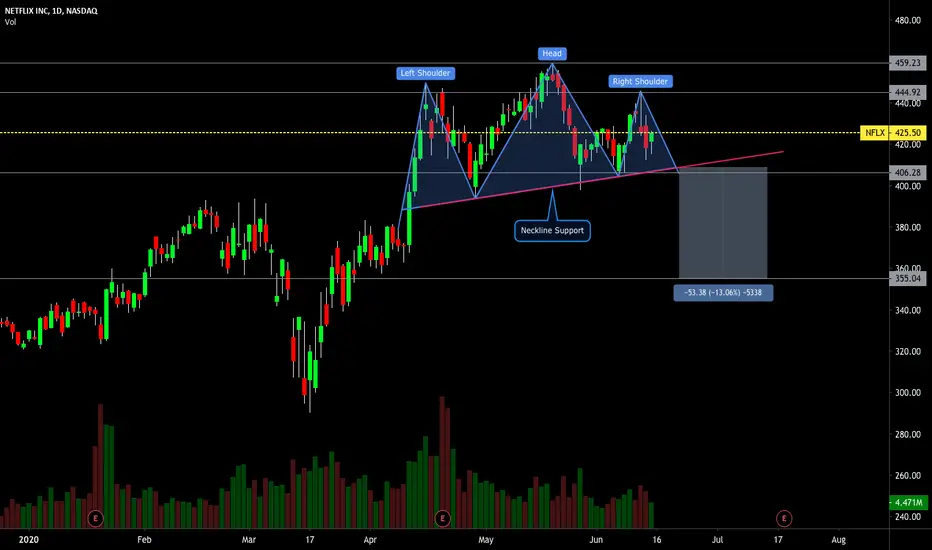
NFLX (Netflix) is developing a potential Head & Shoulders price pattern, on the daily chart.
Neckline Support in red is approximately $405 to $408 range.
Downside breakdown target would be -13%, or approximately $355 range.
If the H&S fails, NFLX would need to breakout above $444 and $459 to continue the uptrend.
Neckline Support in red is approximately $405 to $408 range.
Downside breakdown target would be -13%, or approximately $355 range.
If the H&S fails, NFLX would need to breakout above $444 and $459 to continue the uptrend.
Trade geschlossen: Stop wurde erreicht
Resistance Targets reached.H&S pattern did not complete.

Follow Me on TradingView and Youtube.
Social Media links are in my profile.
Boost, comment, share to support.
All posts are not financial advice.
Social Media links are in my profile.
Boost, comment, share to support.
All posts are not financial advice.
Haftungsausschluss
Die Informationen und Veröffentlichungen sind nicht als Finanz-, Anlage-, Handels- oder andere Arten von Ratschlägen oder Empfehlungen gedacht, die von TradingView bereitgestellt oder gebilligt werden, und stellen diese nicht dar. Lesen Sie mehr in den Nutzungsbedingungen.